The first post covered getting real data into Dependency-Track: SBOM ingestion, three vulnerability sources, two malware feeds, and KEV/EPSS filtering to cut CVSS-driven noise. That gets a project to a ranked list of real findings. It says nothing about whether any of them actually apply to this codebase. This post covers the part that does.
Reachability tooling doesn’t cover this stack
I looked into whether an open-source static reachability tool could replace judgment-based triage entirely. Google’s OSV-Scanner has a real call-graph reachability feature, but its coverage doesn’t match this stack. Go is stable, Rust and Java are experimental, npm has zero support (confirmed directly by a maintainer), and Python is an open, stale feature request with no implementation. Across the actual dependency trees here, that’s real signal on maybe 1% of components and nothing on the rest. Even the one ecosystem it does support has a documented blind spot. Calls made via reflect or unsafe are invisible to it, which is specifically dangerous if you’re using the result to auto-clear findings. Not worth adding for this stack. Worth revisiting if the codebase ever shifts toward Go or Java.
The actual triage workflow is an MCP server exposing Dependency-Track’s findings as tools, plus a skill that pulls unaudited findings, clones the repo, and traces each one against real usage before recording a verdict. One concrete example. A pillow CVE covering font, PDF, and TGA parsing got ruled out because the only Image.open() call in that service processes a Playwright-generated screenshot the app made itself, never externally-served image bytes. A call-graph tool can’t prove that either way. It takes understanding what the input actually is, and it’s exactly the kind of judgment call that shouldn’t be rubber-stamped from a package name alone.
One MCP bug produced a genuinely confusing failure mode. Dependency-Track’s finding API excludes suppressed findings by default, and the write tool suppresses NOT_AFFECTED verdicts by default. Combine those and any finding the tool had already corrected once became permanently invisible to itself, including for correcting it again later. It read as “the finding disappeared, is the data gone.” It wasn’t. Still fully present and visible in the UI with “show suppressed” on, just unreachable through the API call the tool happened to be making. I fixed it by always passing suppressed=true on every finding lookup. That flag doesn’t filter for suppressed findings. It tells the API to stop excluding them, so the response includes both suppressed and unsuppressed findings instead of silently dropping the suppressed half.
A triage verdict needs to expire when the code changes
A triage verdict reflects the code as it existed the moment someone checked it. Take that pillow example from earlier, cleared because the only Image.open() call in that service processes a self-generated screenshot, never external input. Six months from now someone adds a profile-picture upload feature that happens to route through the same call. The vulnerable path is now reachable with attacker-controlled input, exactly the scenario the CVE describes, and by default nothing notices. The sync keeps running, Dependency-Track keeps seeing the same component and the same CVE, and it just keeps showing the old NOT_AFFECTED verdict, suppressed, until a human reopens it.
I looked at two ways to close this and rejected both. A time-based reminder, “this verdict is 90 days old, recheck it,” is cheap to build but doesn’t know whether the code actually changed. It either nags uselessly or creates false confidence that nagging equals coverage. Fully automatic code-path-change detection sounds better, but there’s no reliable way to know which files were relevant to a verdict reached through informal reasoning. You’d end up re-checking everything on every commit, or missing the one change that matters.
What I built instead is narrower and cheaper. Usage-fingerprint tracking, through two more MCP tools. record_usage_fingerprint runs right after any NOT_AFFECTED verdict, greps the repo for files that reference the component by name, and stores that file list. check_usage_drift runs at the start of every /triage pass, before touching any new findings, and re-greps every previously-fingerprinted component against the current repo state. If the file list changed, that verdict gets flagged for a second look instead of being trusted forever.
This doesn’t prove a component actually became reachable. It converts “nothing ever re-checks this” into “here’s the specific handful of components worth a second look,” a much narrower and cheaper question than the real one, but one a script can actually answer. Testing it turned up its own small gap. Searching a repo for “pillow” finds nothing, because every real usage is from PIL import Image. PyPI’s distribution name and Python’s import name aren’t always the same string. I fixed it with a short override list for the common mismatches (pillow to PIL, pyyaml to yaml, beautifulsoup4 to bs4, and a handful of others), documented as incomplete by design rather than pretending to solve the general case.
Then I actually simulated the scenario instead of just describing it. I took a local clone, added a stand-in file for that hypothetical profile-picture-upload feature with a second Image.open() call, and ran check_usage_drift against it. It correctly flagged pillow as drifted, listed the new file, and produced an empty result again once the file was removed. Every reachability-based tool shares the same underlying problem. None of them re-verify their own assumptions as a codebase evolves. Here, at least, the drift itself doesn’t need a human to remember to look for it. Whether the drift is actually dangerous still does.
That last sentence skips over a gap that still needed closing. check_usage_drift only runs during a /triage pass, and nothing runs /triage itself. There’s no cron, no webhook, no hook off the sync pipeline. It’s an interactive, human-in-the-loop workflow by design, since writing a verdict into Dependency-Track needs judgment, not a scheduler. The honest failure mode isn’t drift going undetected. It’s nobody remembering to check. A project untriaged for four months looks, from the sync dashboard, identical to one triaged yesterday.
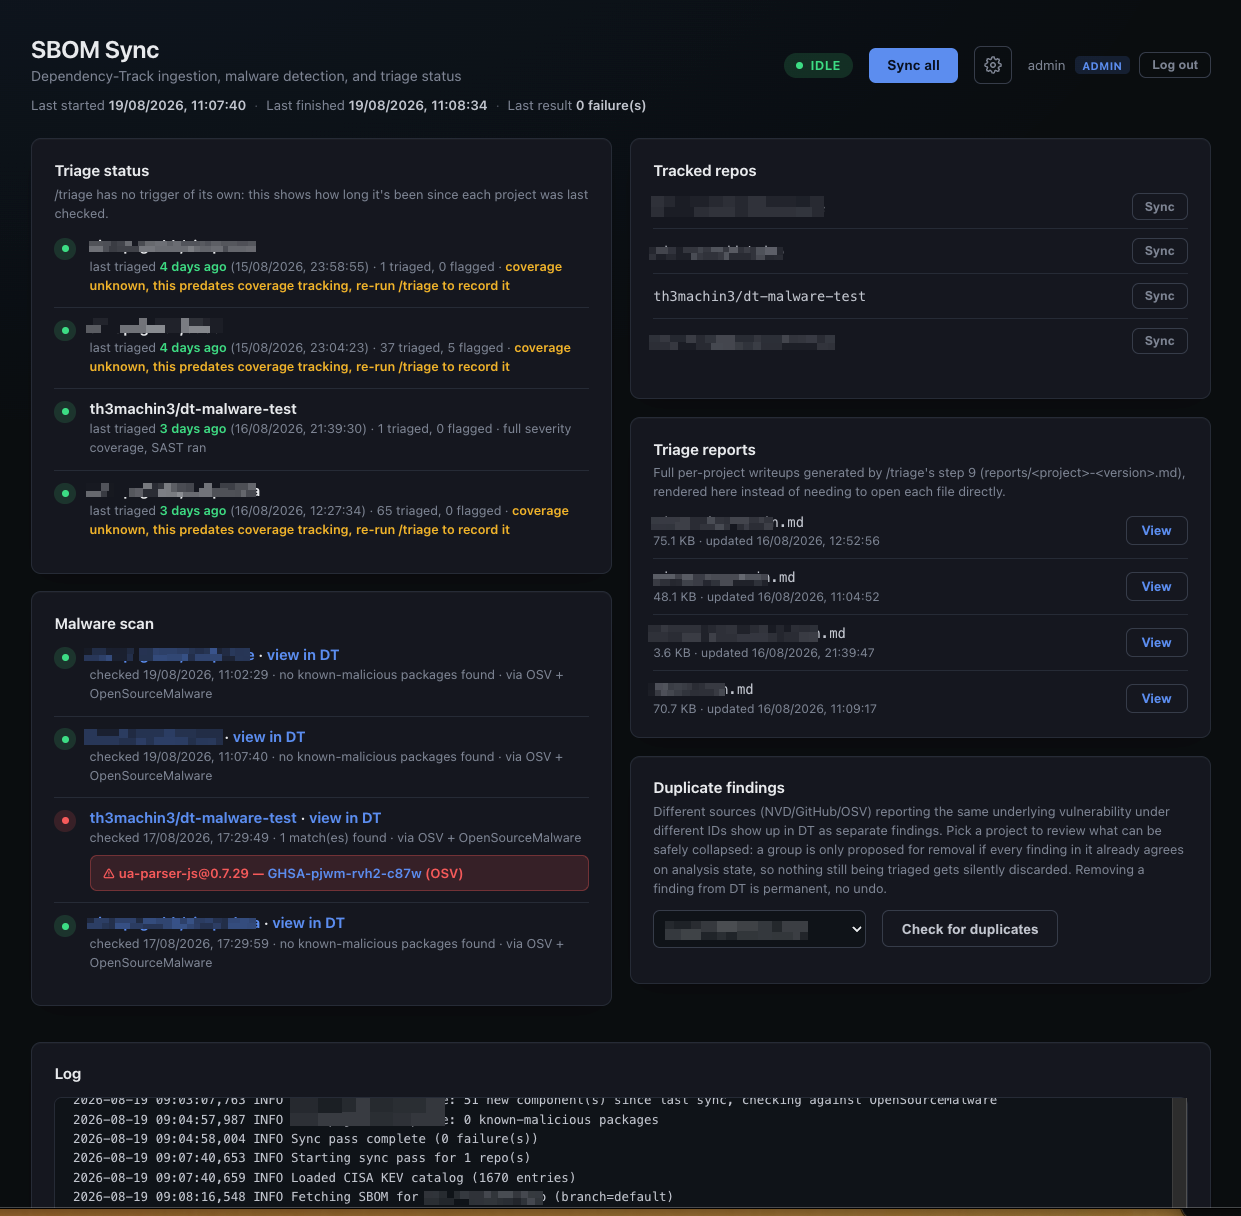
I fixed that the same way as the malware panel. I made the gap visible instead of silent. A third MCP tool, record_triage_run, gets called at the end of every /triage pass and writes a timestamp plus how many findings got a verdict versus were left flagged. The sync dashboard reads that file (a separate process from the one that writes it, since /triage runs in an interactive session and the dashboard is a container, so it’s a plain read-only bind mount, no API involved) and shows a Triage status row per project: green under 30 days, amber under 90, red and “never triaged” otherwise. It doesn’t make anyone run /triage more often. It makes the fact that nobody has impossible to miss.
Recency alone is a misleading signal too. A project triaged two days ago under a narrow, HIGH-only pass and one triaged today with full severity coverage plus a SAST run used to look identical on that panel, both just “recent,” both green. record_triage_run now also records what the pass actually covered, so the panel shows “full severity coverage, SAST ran” next to a thorough pass and “partial (CRITICAL, HIGH), no SAST” next to a thin one, instead of collapsing both into the same color. A run recorded before this existed shows as “coverage unknown,” not silently assumed to be either.
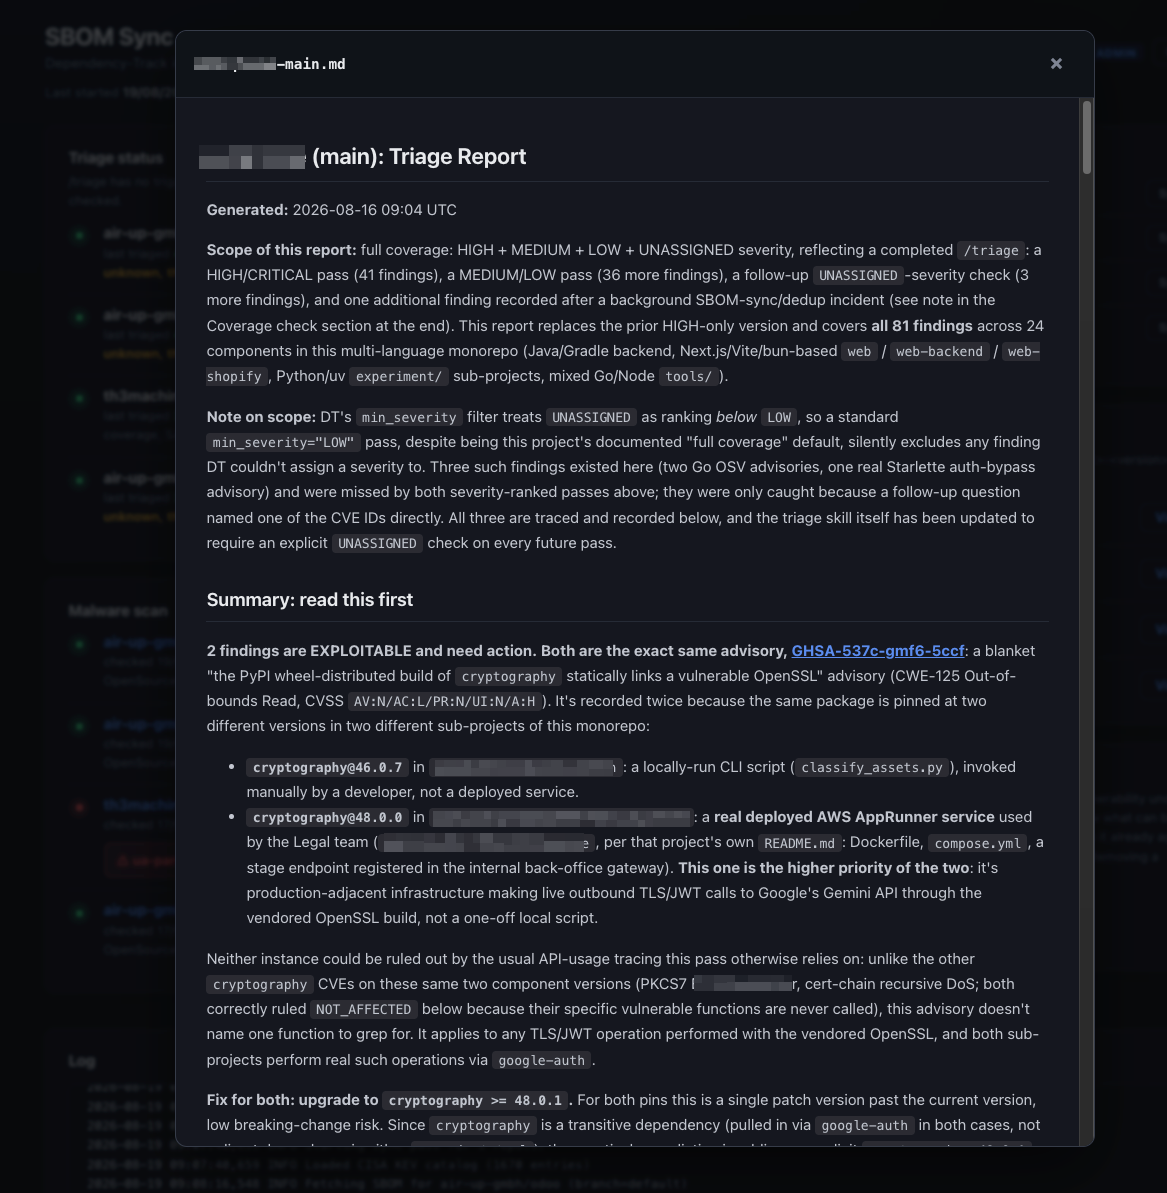
A timestamp on a dashboard says a project got triaged. It says nothing about what was actually found. Every /triage pass also regenerates reports/<project>-<version>.md, a full write-up of the project’s entire finding set, not just what changed in that pass. Each component gets its own section, each finding its own subsection naming the exact verdict, the file and function it was traced through, and, for anything genuinely reachable, the specific version that fixes it. Every CVE and GHSA ID links straight to its real advisory page instead of sitting there as plain text someone has to go search for.
The report regenerates from scratch on every pass, reflecting Dependency-Track’s current state rather than a diff or a dated snapshot. That’s deliberate. A stale copy next to a fresh one would just show old verdicts as if they still held. DT itself has no field for “where in the codebase this lives,” so this file is the only place that context survives in one document instead of being scattered across a dozen separate audit-trail panels, one click apart.
What’s running now
GitHub SBOM export, syft conversion, upload, three vulnerability sources, two malware feeds, KEV and EPSS checks, all on a schedule editable from a small dashboard with per-repo sync. An MCP-driven triage workflow handles anything that needs an actual human-grade judgment call. Usage-drift detection keeps a triage verdict from sitting unquestioned forever, and a staleness indicator keeps a project nobody’s re-checked in months from looking identical to one that’s current. All container images are pinned by digest, not latest, so a rebuild in six months doesn’t silently change what’s running.
Coverage still has real gaps. OSV-Scanner-style reachability doesn’t cover this stack. Usage-drift tracking only watches components that went through /triage, and only for npm, PyPI, and Go. No amount of tooling replaces someone occasionally re-running the whole thing on a schedule anyway. Each gap here is written down instead of assumed away, and the parts that could be made mechanical, are.
All of this currently runs as a Docker Compose stack on my own machine, not a deployed service. That’s fine for building it out and validating the pipeline against real repos, but it’s not where this should end up. The obvious next step is moving it to actual cloud infrastructure and replacing the local sync loop’s polling with GitHub Actions workflows. SBOM export and upload would trigger directly off a push or a schedule, instead of a container on my laptop deciding when to ask GitHub for one. That also removes the biggest single point of failure this setup currently has. If my machine is off, nothing syncs.