How Model Context Protocol turned a mess of API integrations into something an LLM can actually use, and why tool filtering matters more than you’d think.
In the previous posts I covered how Heimdall triages alerts and how it uses a graph database for correlation. But there’s a layer I glossed over: how does the agent actually talk to CrowdStrike, CloudWatch, VirusTotal, Elastic, and Atlassian?
The answer is MCP, the Model Context Protocol. It’s an open standard for connecting AI models to external tools, and it’s what turns Heimdall from “an LLM with a system prompt” into something that can actually investigate security incidents.
This post gets into how MCP works in practice, how I deployed it, and the design decisions around tool access control that I think matter more than the protocol itself.
The Problem MCP Solves
Before MCP, connecting an LLM to external APIs meant writing custom function definitions for every tool, managing auth for every service, and building bespoke request/response handling for every provider. If you switched from OpenAI to Gemini, you’d rewrite your tool definitions because the function calling format was different.
MCP standardizes this. An MCP server is a lightweight process that exposes tools as structured JSON-RPC endpoints. The LLM client discovers available tools at startup, calls them by name with JSON arguments, and gets structured results back. The server handles auth, API calls, pagination, error handling, and response formatting. The LLM never sees raw HTTP.
For Heimdall, this means the agent doesn’t know or care that falcon_search_detections hits the CrowdStrike Alerts v2 API under the hood, or that vt_get_file_report calls the VirusTotal v3 API. It just calls tools and gets results.
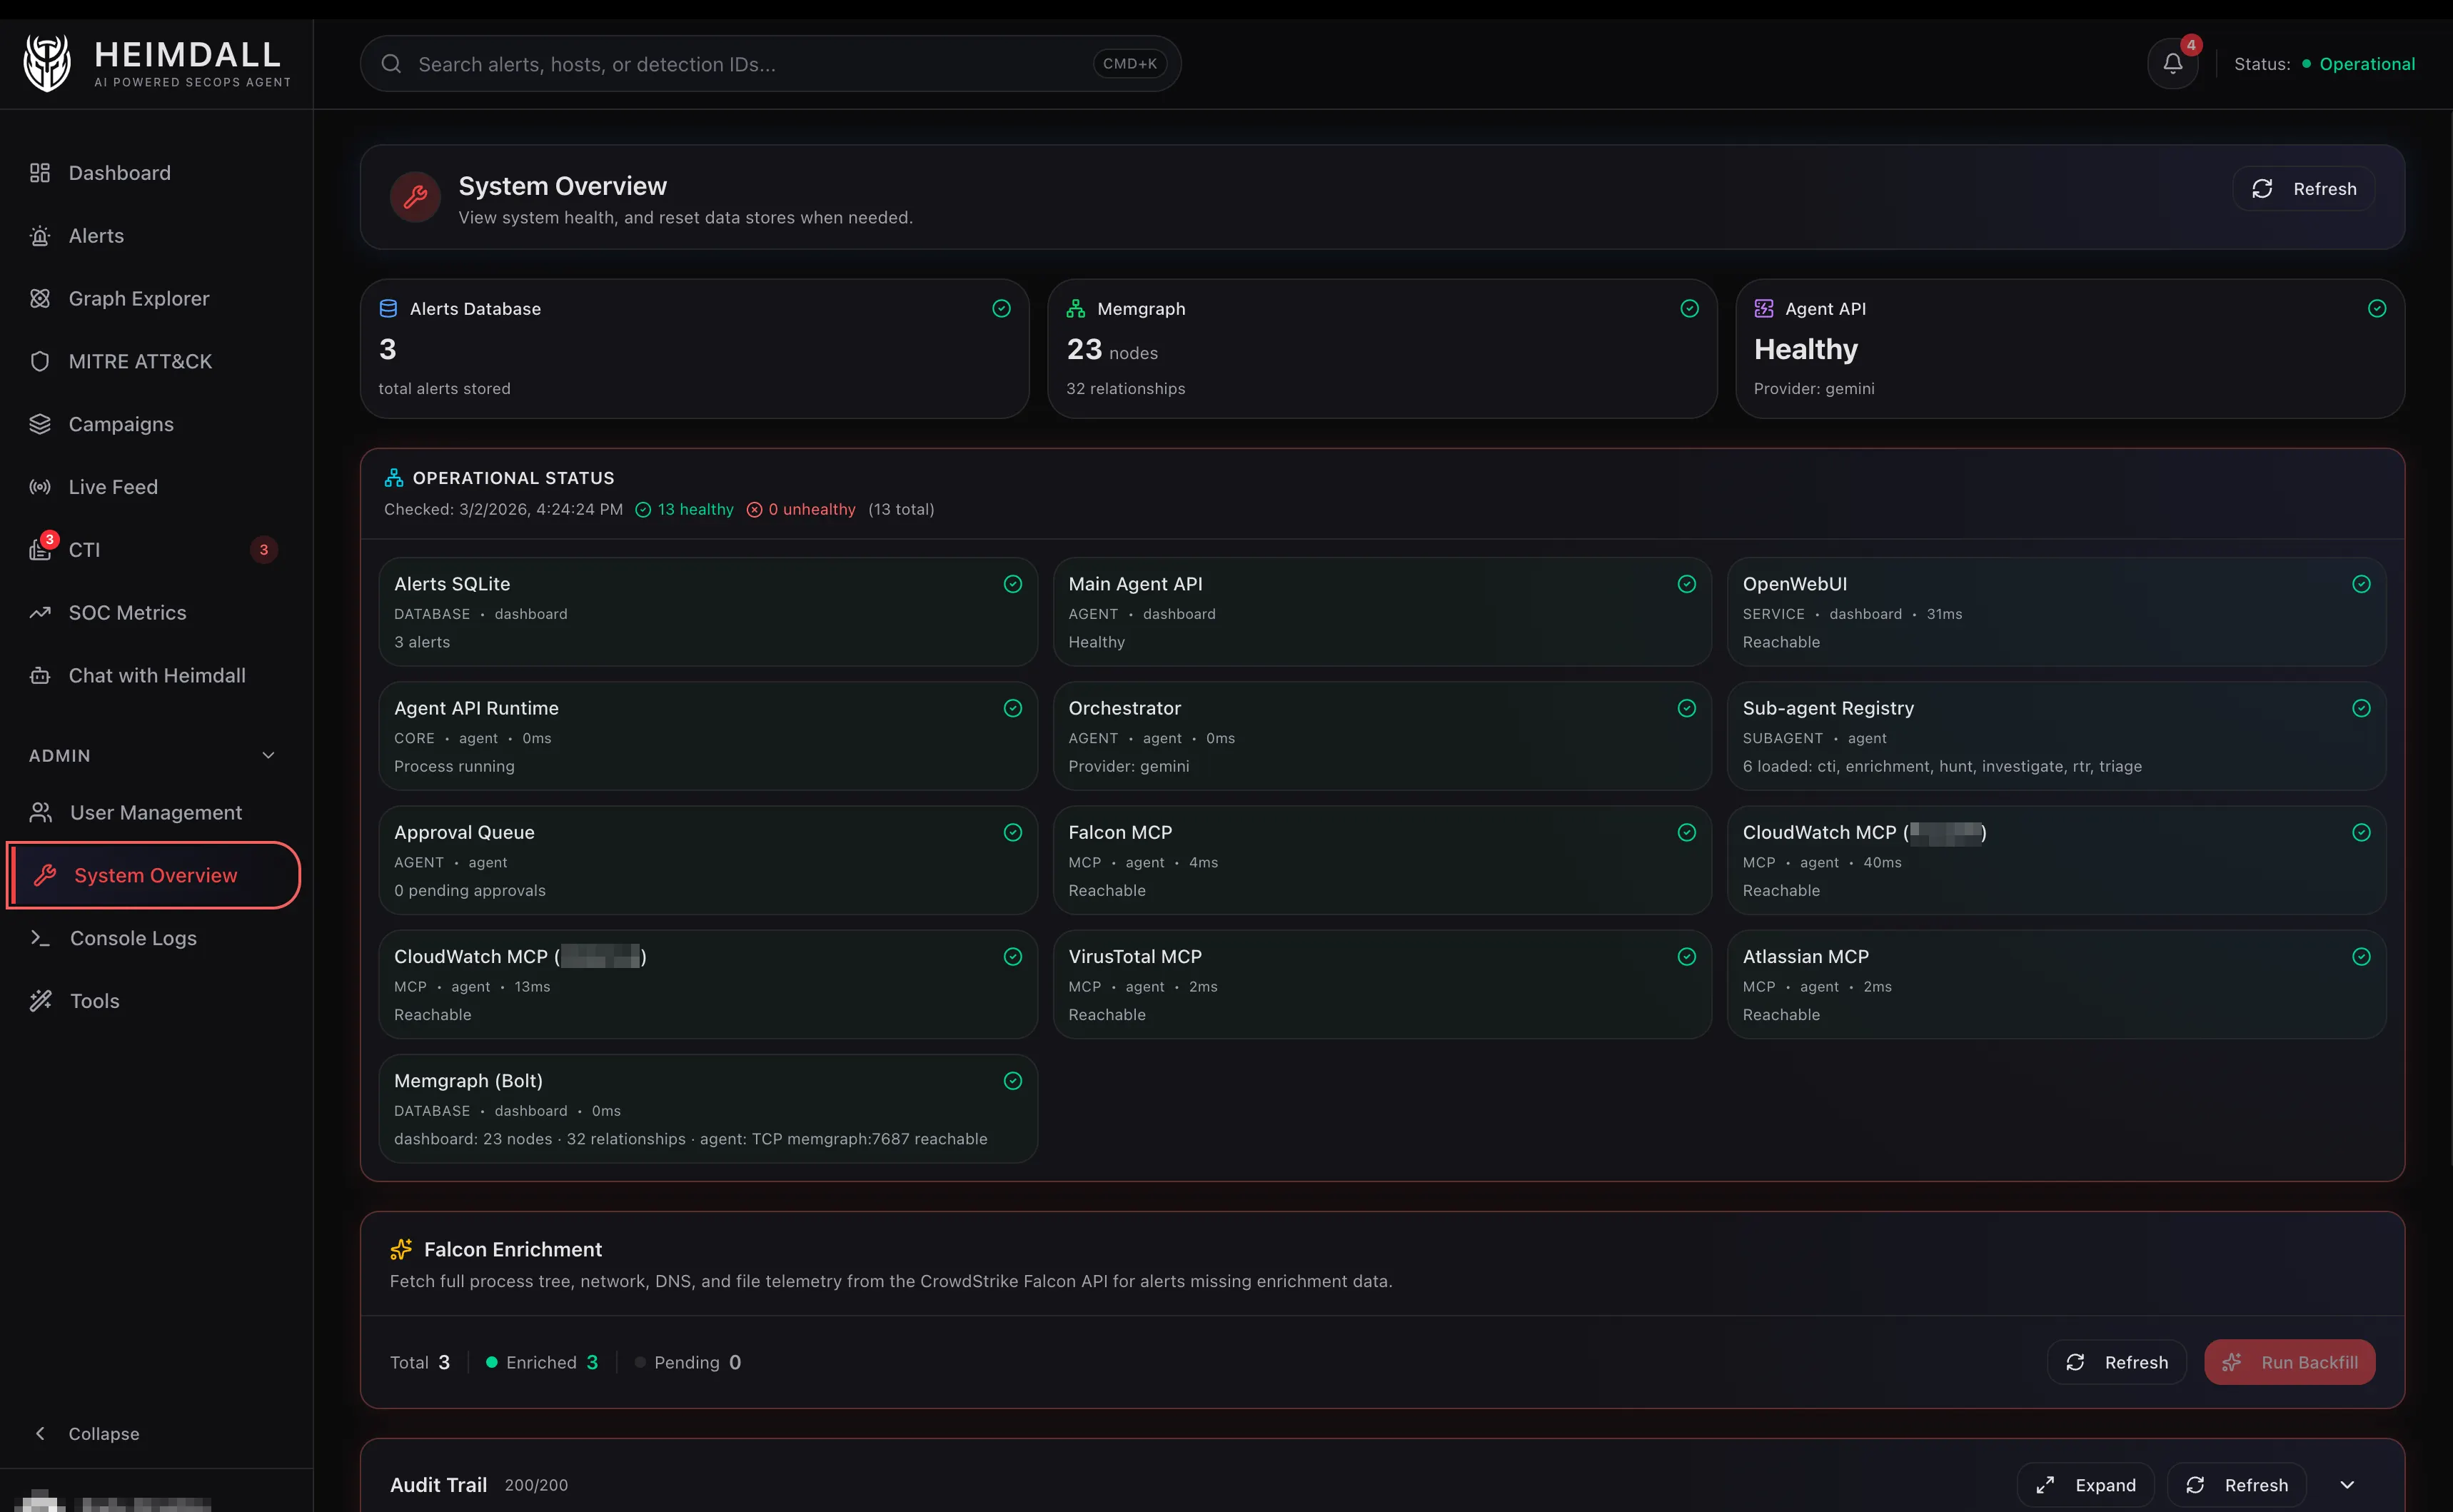
The Architecture
Heimdall runs six MCP servers as Docker sidecar containers, each on its own isolated network:
┌─────────────────────────────────────────────────┐
│                   Agent                         │
│    (on all networks, calls MCP via HTTP)        │
└──┬──────┬──────┬──────┬──────┬──────┬───────────┘
   │      │      │      │      │      │
   ▼      ▼      ▼      ▼      ▼      ▼
Falcon  CW-1   CW-2    VT   Elastic Atlassian
(8000) (8000) (8000) (8000)  (API)  (8000)
- Falcon MCP - CrowdStrike Falcon APIs (detections, hosts, incidents, NGSIEM, RTR, intel) - Official CrowdStrike image, streamable-http transport
- CloudWatch - AWS CloudWatch Logs Insights, Metrics, Alarms - AWS Labs MCP server
- VirusTotal - File, IP, domain, URL reputation - Community npm package wrapped with supergateway
- Elastic - ES|QL queries across multiple index patterns - Direct API (not MCP sidecar)
- Atlassian - Jira ticket updates, Confluence lookups - Community MCP server image
How Tool Discovery Works
When the agent starts up, it connects to each MCP server and calls tools/list. Each server returns its available tools with names, descriptions, and parameter schemas. The agent aggregates these into a single tool catalog.
For the Falcon MCP server alone, this returns around 30 tools across seven categories:
- Hosts -
falcon_search_hosts,falcon_get_host_details,falcon_contain_host,falcon_lift_containment - Detections -
falcon_search_detections,falcon_get_detection_details,falcon_update_detection - Incidents -
falcon_search_incidents,falcon_get_incident_details - NGSIEM -
falcon_search_ngsiem(CQL queries against LogScale) - RTR -
falcon_rtr_init_session,falcon_rtr_execute_command,falcon_rtr_run_script,falcon_rtr_close_session - Intel -
falcon_search_actors,falcon_search_indicators,falcon_search_reports - Spotlight -
falcon_search_vulnerabilities,falcon_get_vulnerability_details
Add CloudWatch, VirusTotal, Elastic, and Atlassian tools and the total catalog is around 60–70 tools. That’s way too many to hand to an LLM all at once.
Tool Filtering: The Most Important Design Decision
This is the part I think matters most, and it’s not really about MCP at all. It’s about what happens when you give an LLM access to 70 tools and say “investigate this alert.”
The answer: it panics. It makes too many calls, picks the wrong tools, and burns through your token budget trying to figure out what’s relevant. Worse, it might call a tool it shouldn’t. A triage agent has no business initiating RTR sessions. An enrichment agent has no business querying CloudWatch.
Heimdall solves this with tool filters. Each sub-agent has a set of glob patterns that control which tools it can see. When the orchestrator spins up the triage agent, it calls get_filtered_tools(["heimdall_*", "falcon_search_detections", "falcon_search_ngsiem", "vt_get_*", ...]). The triage agent only sees maybe 15 tools instead of 70.
Here’s what each agent can actually access:
| Agent | Can use | Cannot use |
|---|---|---|
| Triage | Local alerts, Falcon detections/hosts/behaviors, NGSIEM, CloudWatch queries, VirusTotal lookups, Jira | RTR, Falcon Intel, Elastic, Spotlight |
| Hunt | NGSIEM, Falcon detections/hosts, CloudWatch, Elastic | VirusTotal, Jira, RTR, Intel |
| Investigate | Everything Triage has + Elastic, Falcon Intel, IDP | RTR |
| Enrichment | Falcon Intel (actors, indicators, reports), VirusTotal, Spotlight | NGSIEM, CloudWatch, RTR, Elastic |
| RTR | RTR session tools, host search, containment | Everything else |
| CTI | Falcon Intel, NGSIEM, Elastic, VirusTotal, Jira | RTR, CloudWatch, hosts |
Tool Budgets
Filtering controls which tools an agent can use. Budgets control how many times it can use them.
The triage agent gets 6 tool calls max. The investigate agent gets 8. These aren’t soft limits in the system prompt. The orchestrator tracks call count and stops the agent when it hits the limit.
This forces efficiency. A triage agent with 6 calls can’t afford to do a broad “let me check everything” sweep. It has to be strategic:
- Search local alerts (1 call)
- Get detection details if needed (1 call)
- Query NGSIEM for child processes (1 call)
- Maybe check VirusTotal (1 call)
- Post Jira comment (1 call)
- One call left for edge cases
That’s a realistic triage workflow. The budget makes the agent behave like a focused analyst instead of someone who opens 20 tabs and gets lost.
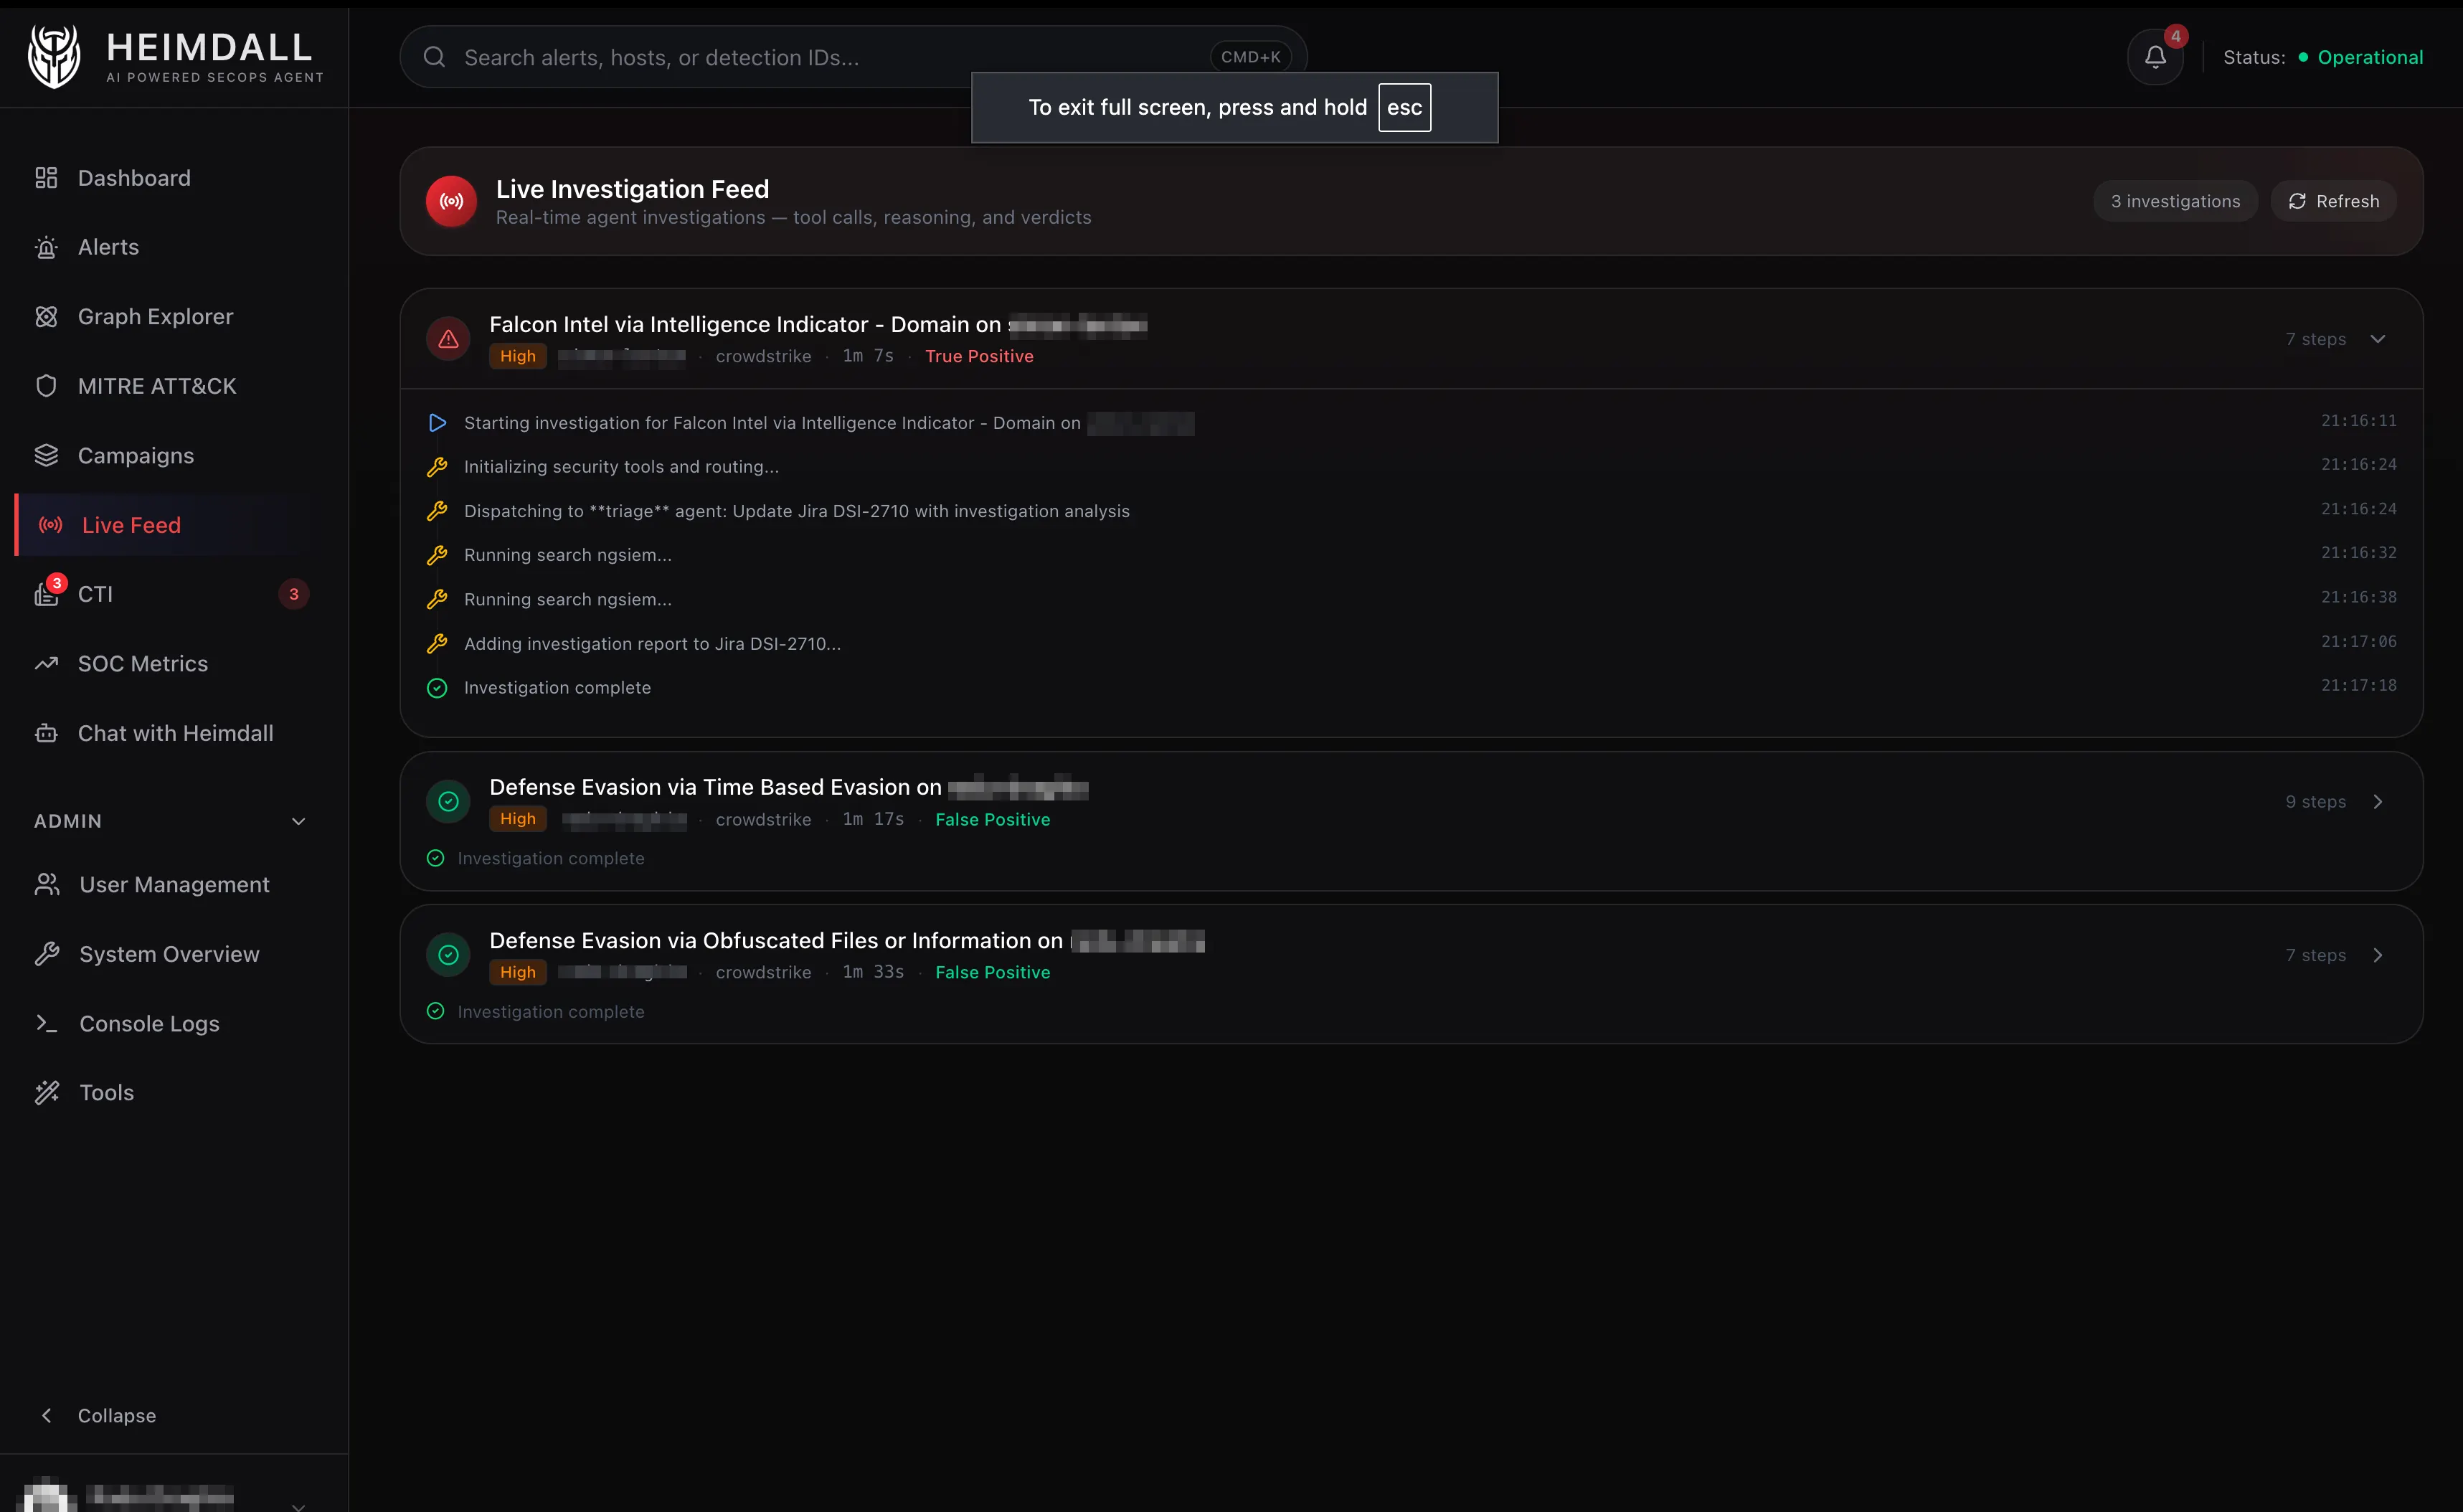
The NGSIEM Tool: Where Things Get Interesting
The single most useful MCP tool in the stack is falcon_search_ngsiem. It runs CQL (CrowdStrike Query Language) queries against LogScale, which stores all the endpoint telemetry: process executions, DNS lookups, network connections, file writes, auth events, etc.
The tool handles a surprising amount of complexity under the hood.
Query normalization. CQL doesn’t have an IN operator, but LLMs love generating them. The tool rewrites Field IN ["a", "b"] to Field = /^(a|b)$/ using regex alternation. It also normalizes multiline queries, fixes regex escape sequences, and converts ISO timestamps to epoch milliseconds.
Async polling. NGSIEM queries are asynchronous. The tool starts a search job, then polls GetSearchStatus every 5 seconds until results are ready or a timeout hits (default 120 seconds). This is invisible to the LLM. It calls falcon_search_ngsiem and gets results back as if it were synchronous.
Repository routing. CrowdStrike has multiple log repositories (search-all, investigate_view, forensics_view). The tool defaults to search-all but accepts a repository parameter for targeted queries.
The typical triage query looks like this:
#event_simpleName=ProcessRollup2
ParentBaseFileName="base64"
ComputerName="xxxx"
This finds all child processes spawned by base64 on a specific host. The LLM generates the CQL, the tool handles the API dance, and the result comes back as structured process telemetry.
Sidecar Deployment
Each MCP server runs as a Docker container with constrained resources (1 CPU, 512MB memory) on an isolated network. The agent container sits on all networks so it can reach every server.
The network isolation matters. The Falcon MCP server can reach CrowdStrike’s API but not the VirusTotal API. The VirusTotal MCP server can reach VirusTotal but not CrowdStrike. If one server gets compromised, it can’t pivot to another service’s credentials.
Most of the servers support HTTP transport natively. CrowdStrike and Atlassian take --transport streamable-http out of the box. CloudWatch uses FastMCP’s built-in HTTP mode with a one-line Python override to bind to 0.0.0.0 instead of localhost.
The one exception is VirusTotal, which is a stdio-based npm package. It’s wrapped with supergateway, a small utility that bridges stdio to HTTP. The Dockerfile is literally four lines.
Caching
Tool results are cached in SQLite with a 1-hour TTL. The cache key is a SHA256 hash of the tool name plus arguments, so identical queries within the hour return instantly without hitting the external API.
Some tools are excluded from caching: RTR session management (falcon_rtr_init_session, falcon_rtr_execute_command, falcon_rtr_close_session) because stale session state would break things.
Investigation results get cached permanently. Once an alert has been triaged, the verdict, summary, and confidence are stored so re-triaging the same alert returns the cached investigation instantly.
Interceptors: Pre and Post Processing
Some tools need special handling that doesn’t belong in the MCP server itself. Heimdall uses interceptors, middleware functions that run before or after a tool call.
Pre-interceptors run before the tool executes:
rtr_safety_checkinspects RTR commands against the tiered policy (read-only, active, admin, blocked) and rejects or flags for approval before the command ever reaches the endpoint.falcon_contain_hostandfalcon_lift_containmentcheck the approval queue. If no approval exists, the tool call is blocked and the user gets a notification to approve via the dashboard.
Post-interceptors run after the tool returns:
rtr_async_pollinghandles RTR commands that return a request ID instead of immediate results. It polls for completion and returns the final output to the LLM as if the command ran synchronously.
The Egress Proxy
All outbound traffic from the agent goes through a Squid proxy with a domain allowlist. The agent can reach LLM provider APIs (Google, Anthropic, OpenAI), security APIs (CrowdStrike, VirusTotal, AWS, Elastic, Atlassian), and 16 CTI feeds (CISA, Talos, SANS, THN, etc). Everything else is blocked.
MCP servers bypass the proxy for internal Docker network traffic, talking to external APIs directly through their own network, but the agent itself is locked down. This means even if the LLM generates a tool call that somehow tries to reach an unexpected domain, the proxy blocks it.
What I Learned
Tool filtering is not optional. My first version gave every agent access to all tools. The triage agent would randomly call Falcon Intel to look up threat actors when it should have been checking NGSIEM for child processes. Adding tool filters immediately made the agents more focused and cheaper to run.
stdio to HTTP is a solved problem. I was worried about running MCP servers that only support stdio transport in Docker containers. Supergateway and FastMCP’s HTTP mode handle this with zero friction.
Cache aggressively. A 1-hour TTL on tool results saves real money. NGSIEM queries cost time (5–30 seconds of polling) and the results rarely change within an hour for the same host and time window. Caching also makes the agent faster, which matters for the live investigation UX.
Network isolation is cheap insurance. Putting each MCP server on its own Docker network took maybe 20 extra lines in docker-compose.yml. If someone finds an RCE in one of the community MCP packages, they get access to one API’s credentials, not all of them.
What’s Next
The next post will shift focus to what it’s actually like to run this in practice: the false positives the agent catches confidently, the edge cases it struggles with, and what a day of automated triage looks like from the SOC perspective.