Tracing a detection from webhook arrival to Slack notification, through 12 Docker containers and zero human intervention.
The previous posts covered the AI triage logic, the graph database, and the MCP tool integration. This one zooms out and looks at the full pipeline: what happens from the moment a CrowdStrike detection fires to the moment a Slack notification lands (or doesn’t) in the security channel.
There are a lot of moving parts. Twelve Docker containers, five isolated networks, an edge auth layer, a reverse proxy, a graph database, an LLM, and a Squid egress proxy. It sounds like a lot, and it is. But each piece exists for a reason, and the end result is an alert pipeline that runs hands-off.
CrowdStrike Detection
      │
      ▼
CrowdStrike Workflow → Jira (ticket created)
      │
      ▼
Jira Automation → POST /api/webhooks/crowdstrike
      │
      ▼
┌─ Cloudflare Access (Service Token validation)
│
├─ Auth Gateway (nginx, strip identity headers)
│
├─ Dashboard (parse, deduplicate, insert)
│     │
│     ├── Graph ingestion (Memgraph, fire-and-forget)
│     │
│     ├── Falcon API enrichment (deterministic, $0)
│     │
│     ├── Re-ingest graph with enriched data
│     │
│     └── Auto-investigation (LLM triage via agent)
│           │
│           ├── Verdict: FP → done, no notification
│           ├── Verdict: TP → Slack alert (red)
│           └── Verdict: Needs Review → Slack alert (amber)
│
└─ Response: { status: "ok" }
The whole thing completes in 10–30 seconds depending on how long the LLM takes. The webhook gets a 200 back almost immediately since the heavy work runs asynchronously.
Step 1: Getting the Alert In
CrowdStrike detections don’t arrive directly. CrowdStrike wants to charge extra for direct webhooks, but they do let you create workflows that raise Jira tickets on detection.
So the pipeline is: a CrowdStrike workflow fires when a detection is created, creates a Jira ticket with the alert details, and then Jira automation picks up the new ticket and POSTs the payload directly to Heimdall’s webhook endpoint.
It’s a workaround, but it actually works in our favour. Every detection automatically has a Jira ticket before Heimdall even sees it, so the triage agent can post its investigation results as Jira comments without creating tickets itself.
The webhook handler (POST /api/webhooks/crowdstrike) supports a couple of payload formats since the shape of what Jira Automation sends can vary depending on how you configure the rule:
- Jira Automation text: a ticket object with key and a details text block containing the alert info, which gets parsed out
- Structured JSON: Jira metadata alongside nested alert details and process context in a cleaner format
Both get normalized into the same internal schema. The handler uses onConflictDoNothing on the external ID so duplicate deliveries (which happen regularly with webhook retry logic) are silently ignored.
Step 2: Edge Authentication
The webhook endpoint is publicly accessible (it has to be: Jira Automation needs to reach it), but it’s protected by Cloudflare Access using a Service Token. The Jira Automation rule includes CF-Access-Client-Id and CF-Access-Client-Secret headers with every request. Cloudflare validates these at the edge before the request ever reaches our infrastructure.
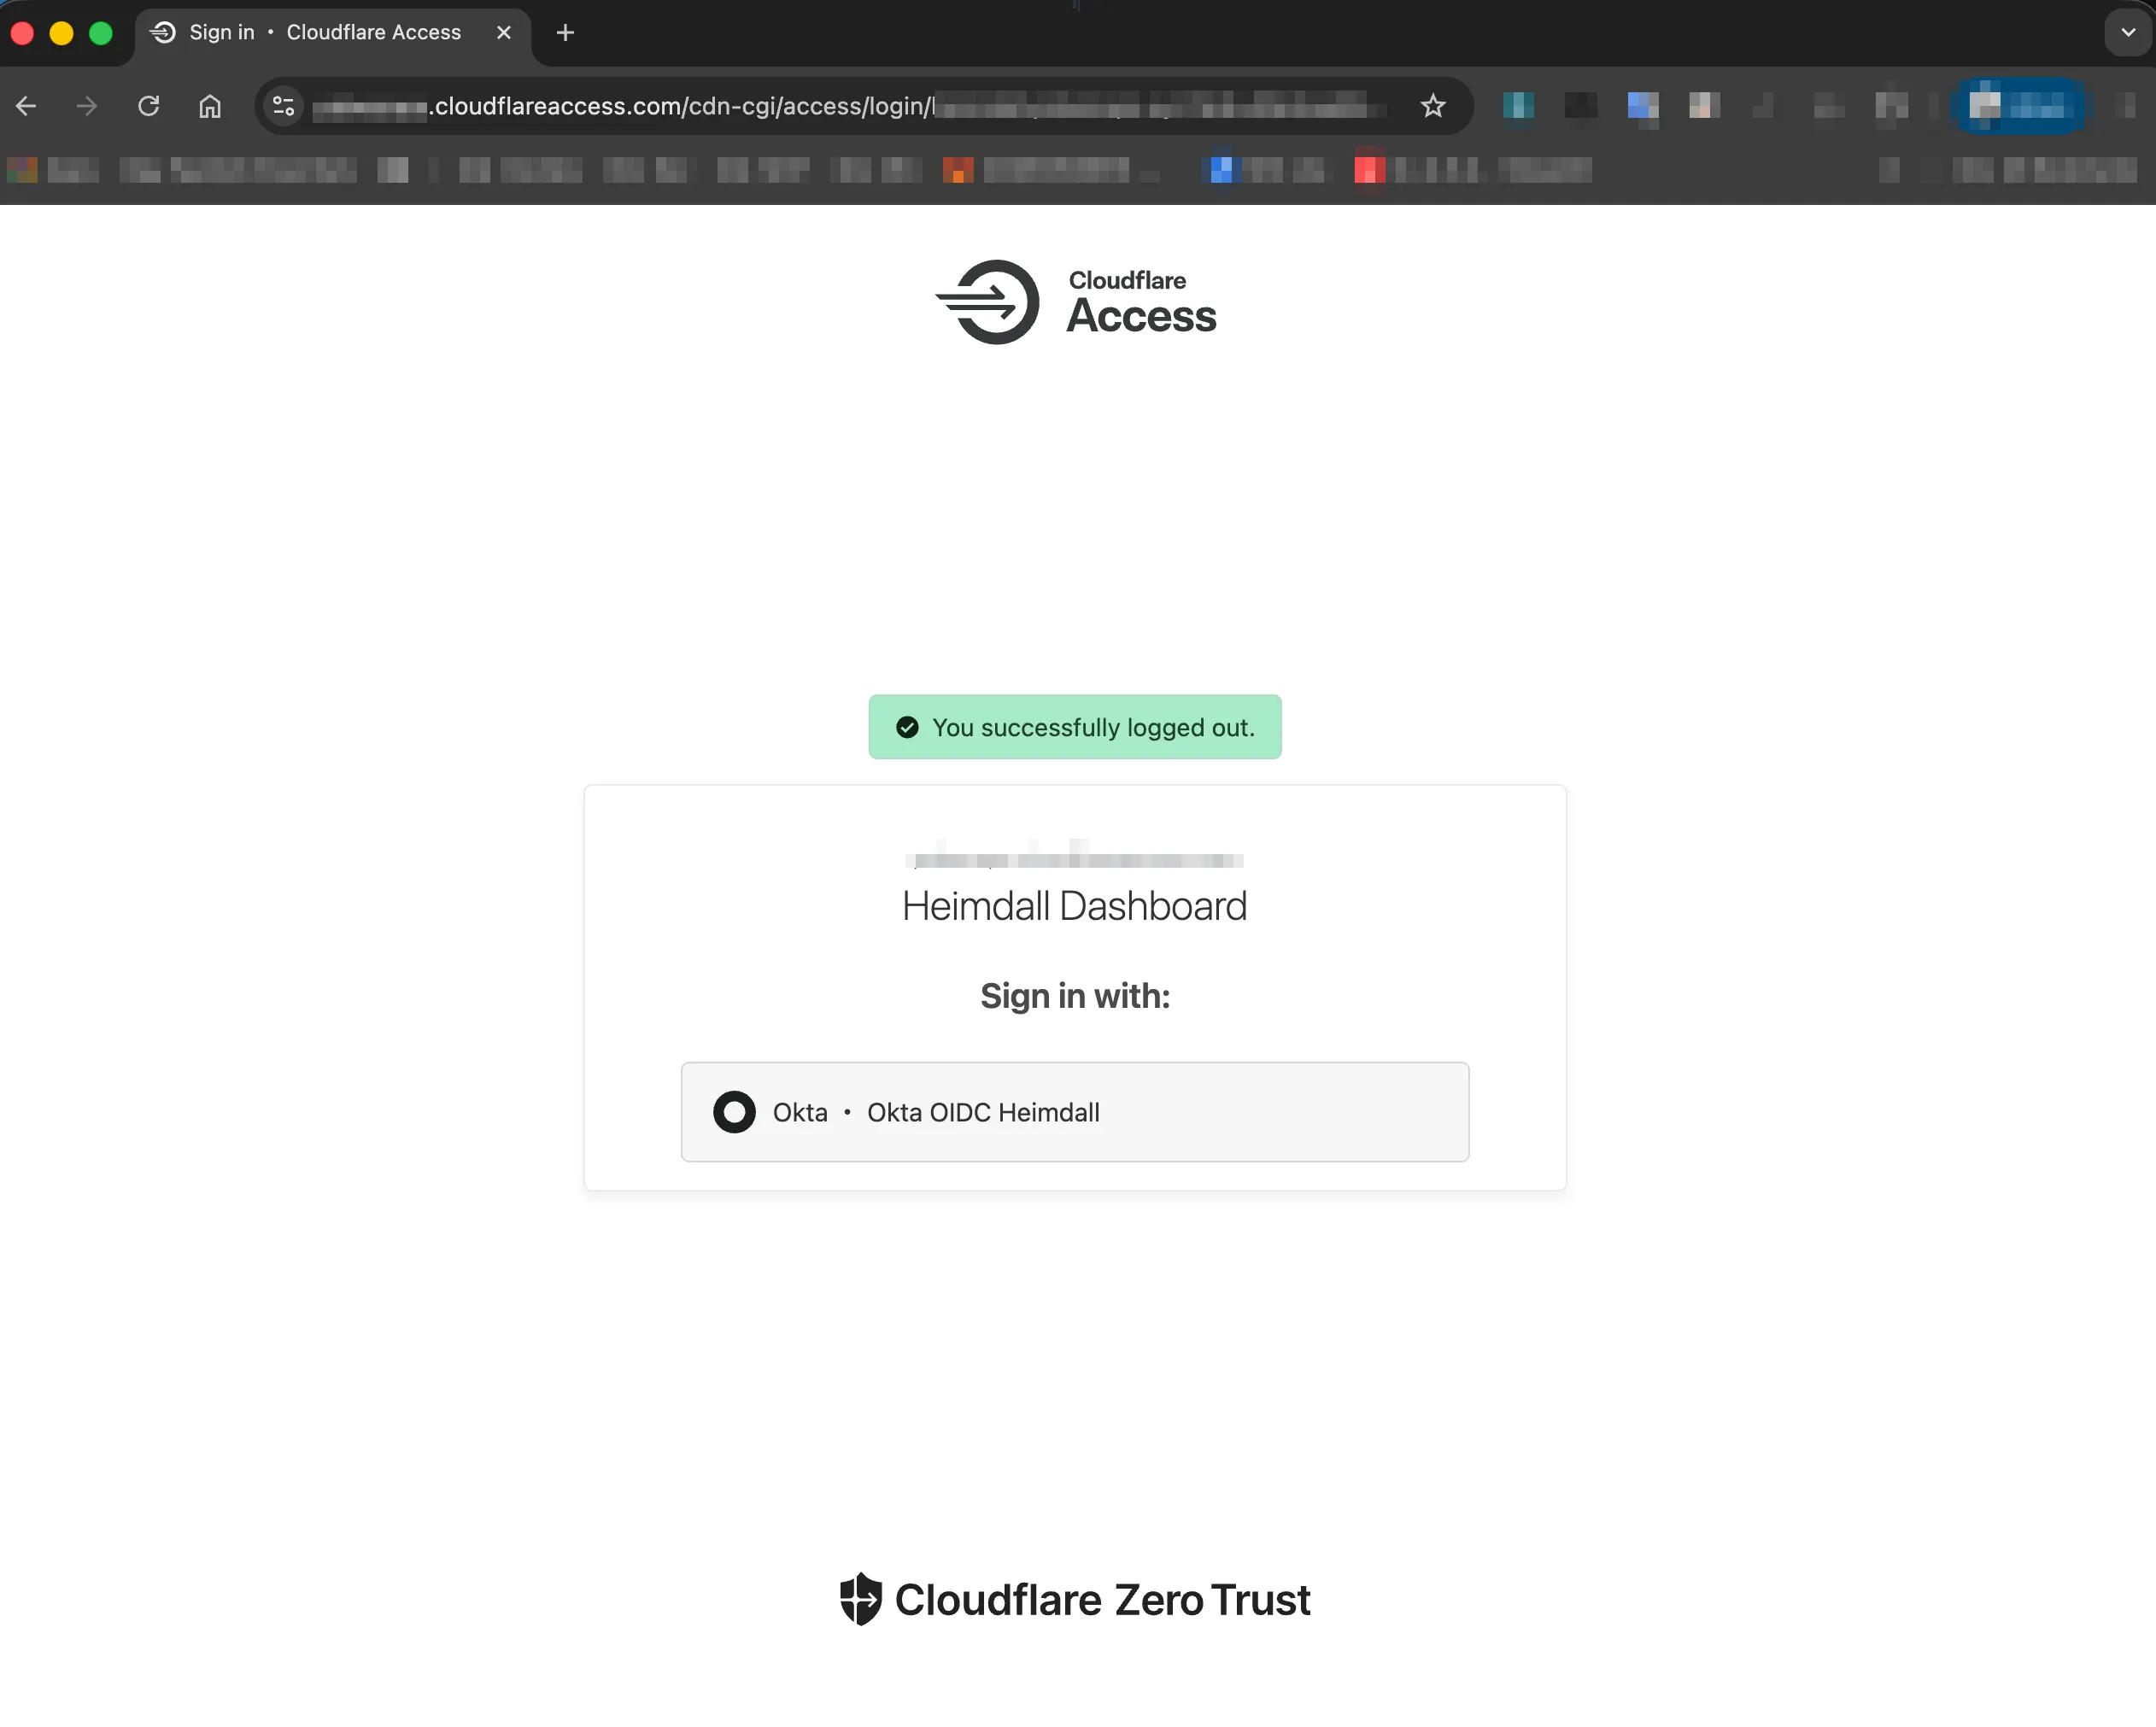
For human users accessing the dashboard, auth works differently. Cloudflare Access presents an Okta OIDC login page. After authentication, it sets a Cf-Access-Authenticated-User-Email header on every request that passes through.
The auth gateway (nginx) maps this header:
Cf-Access-Authenticated-User-Email → X-Auth-Request-Email
                                   → X-Auth-Request-User
For webhooks specifically, nginx strips these identity headers before forwarding to the dashboard. This prevents a scenario where someone crafts a webhook payload with spoofed identity headers and gets treated as an authenticated user.
Step 3: Parse, Deduplicate, Insert
Once the webhook payload passes auth, the dashboard handler:
- Parses it into a normalized alert record (title, severity, source, hostname, external ID, raw payload)
- Inserts into SQLite with
onConflictDoNothingonexternalId - If the alert is new (
status = "new"), kicks off three async operations
The response goes back immediately: { status: "ok", externalId: "..." }. Everything else happens in the background.
Step 4: Graph Ingestion (Round 1)
The first async operation is ingestAlertToGraph. It takes whatever data is available from the webhook payload and creates nodes in Memgraph.
At this point the data is sparse. Maybe a Detection node, a Host node, and a basic MITRE Technique node. But the node exists in the graph immediately, which means the blast radius and campaign views start working even before enrichment completes.
The ingestion uses Cypher MERGE statements throughout. If the host already exists from a previous detection, the new detection links to the same Host node. This is what makes the graph correlation work: shared entities emerge naturally from the data.
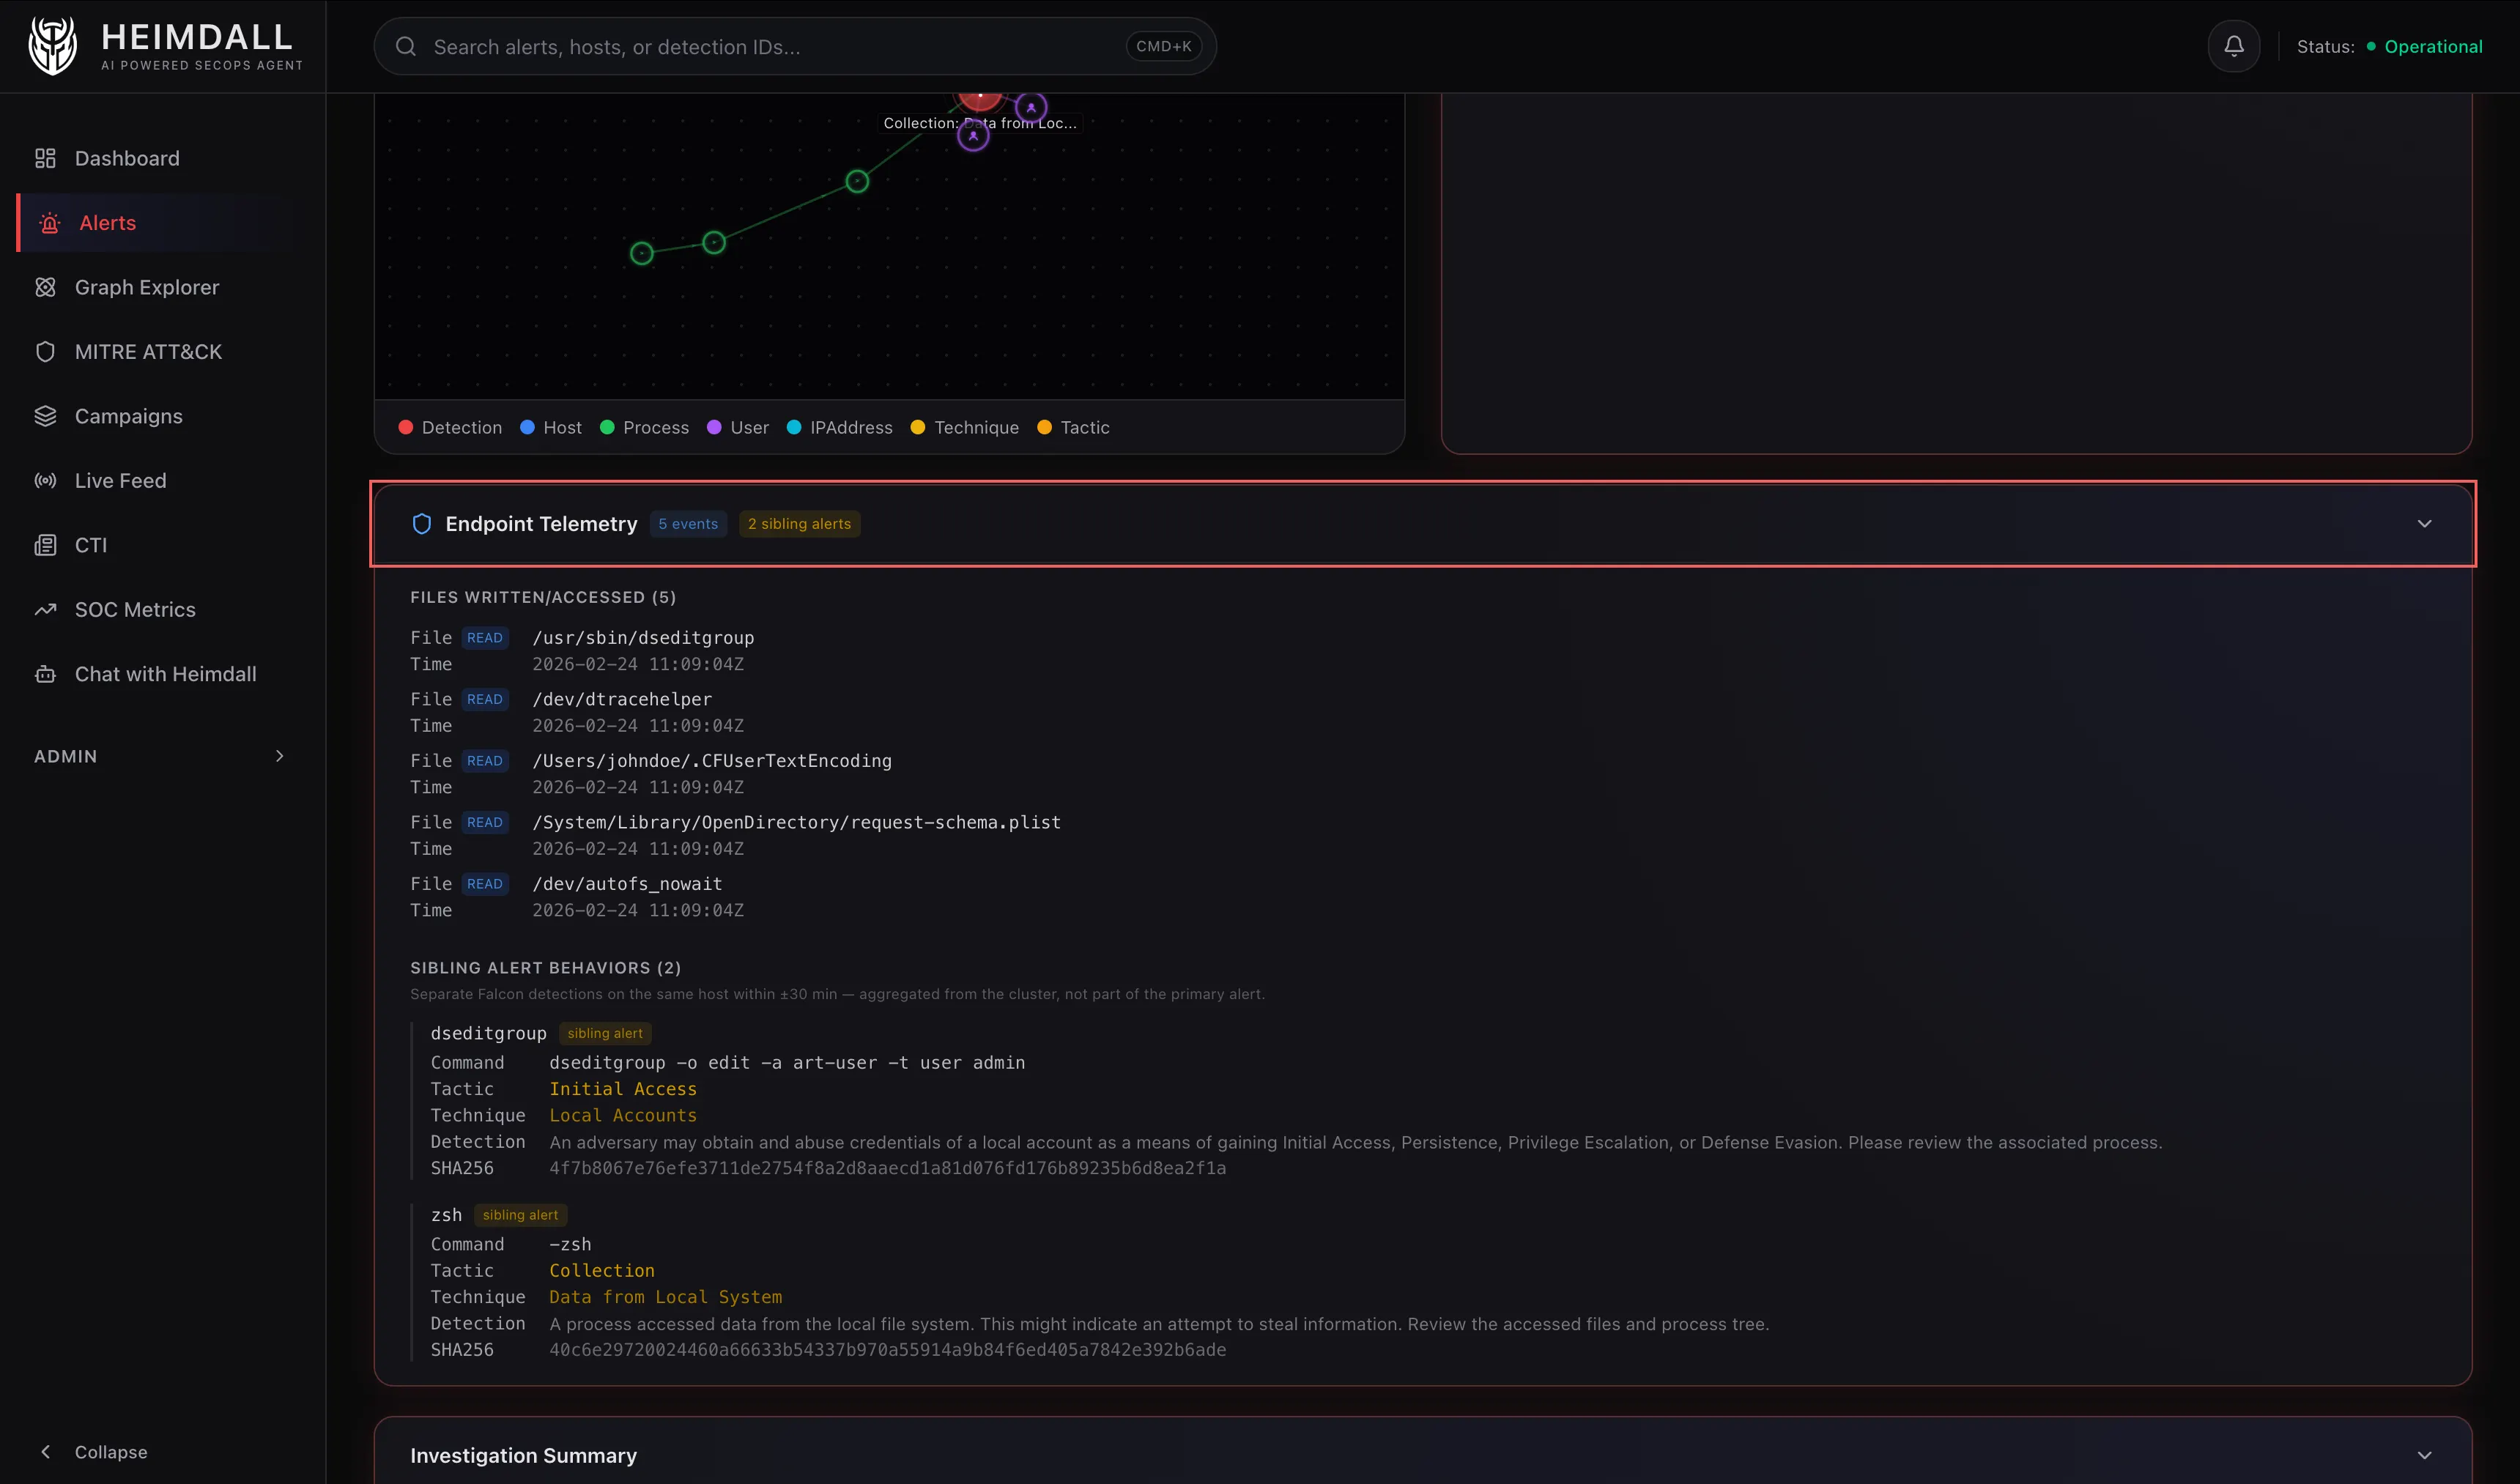
Step 5: Falcon API Enrichment
The second async operation calls the agent’s enrichment endpoint (GET /v1/enrich/detection). This hits the CrowdStrike Falcon Alerts v2 API directly using FalconPy. No LLM involved, no tokens spent.
The enrichment returns:
- Full device context (OS, IPs, MAC, agent version, domain)
- Process tree (triggering process, parent, grandparent) with command lines and SHA256 hashes
- Network connections (remote IPs, ports, protocols)
- DNS requests from around the time of detection
- File activity (writes, reads, modifications)
- MITRE tactic and technique mappings
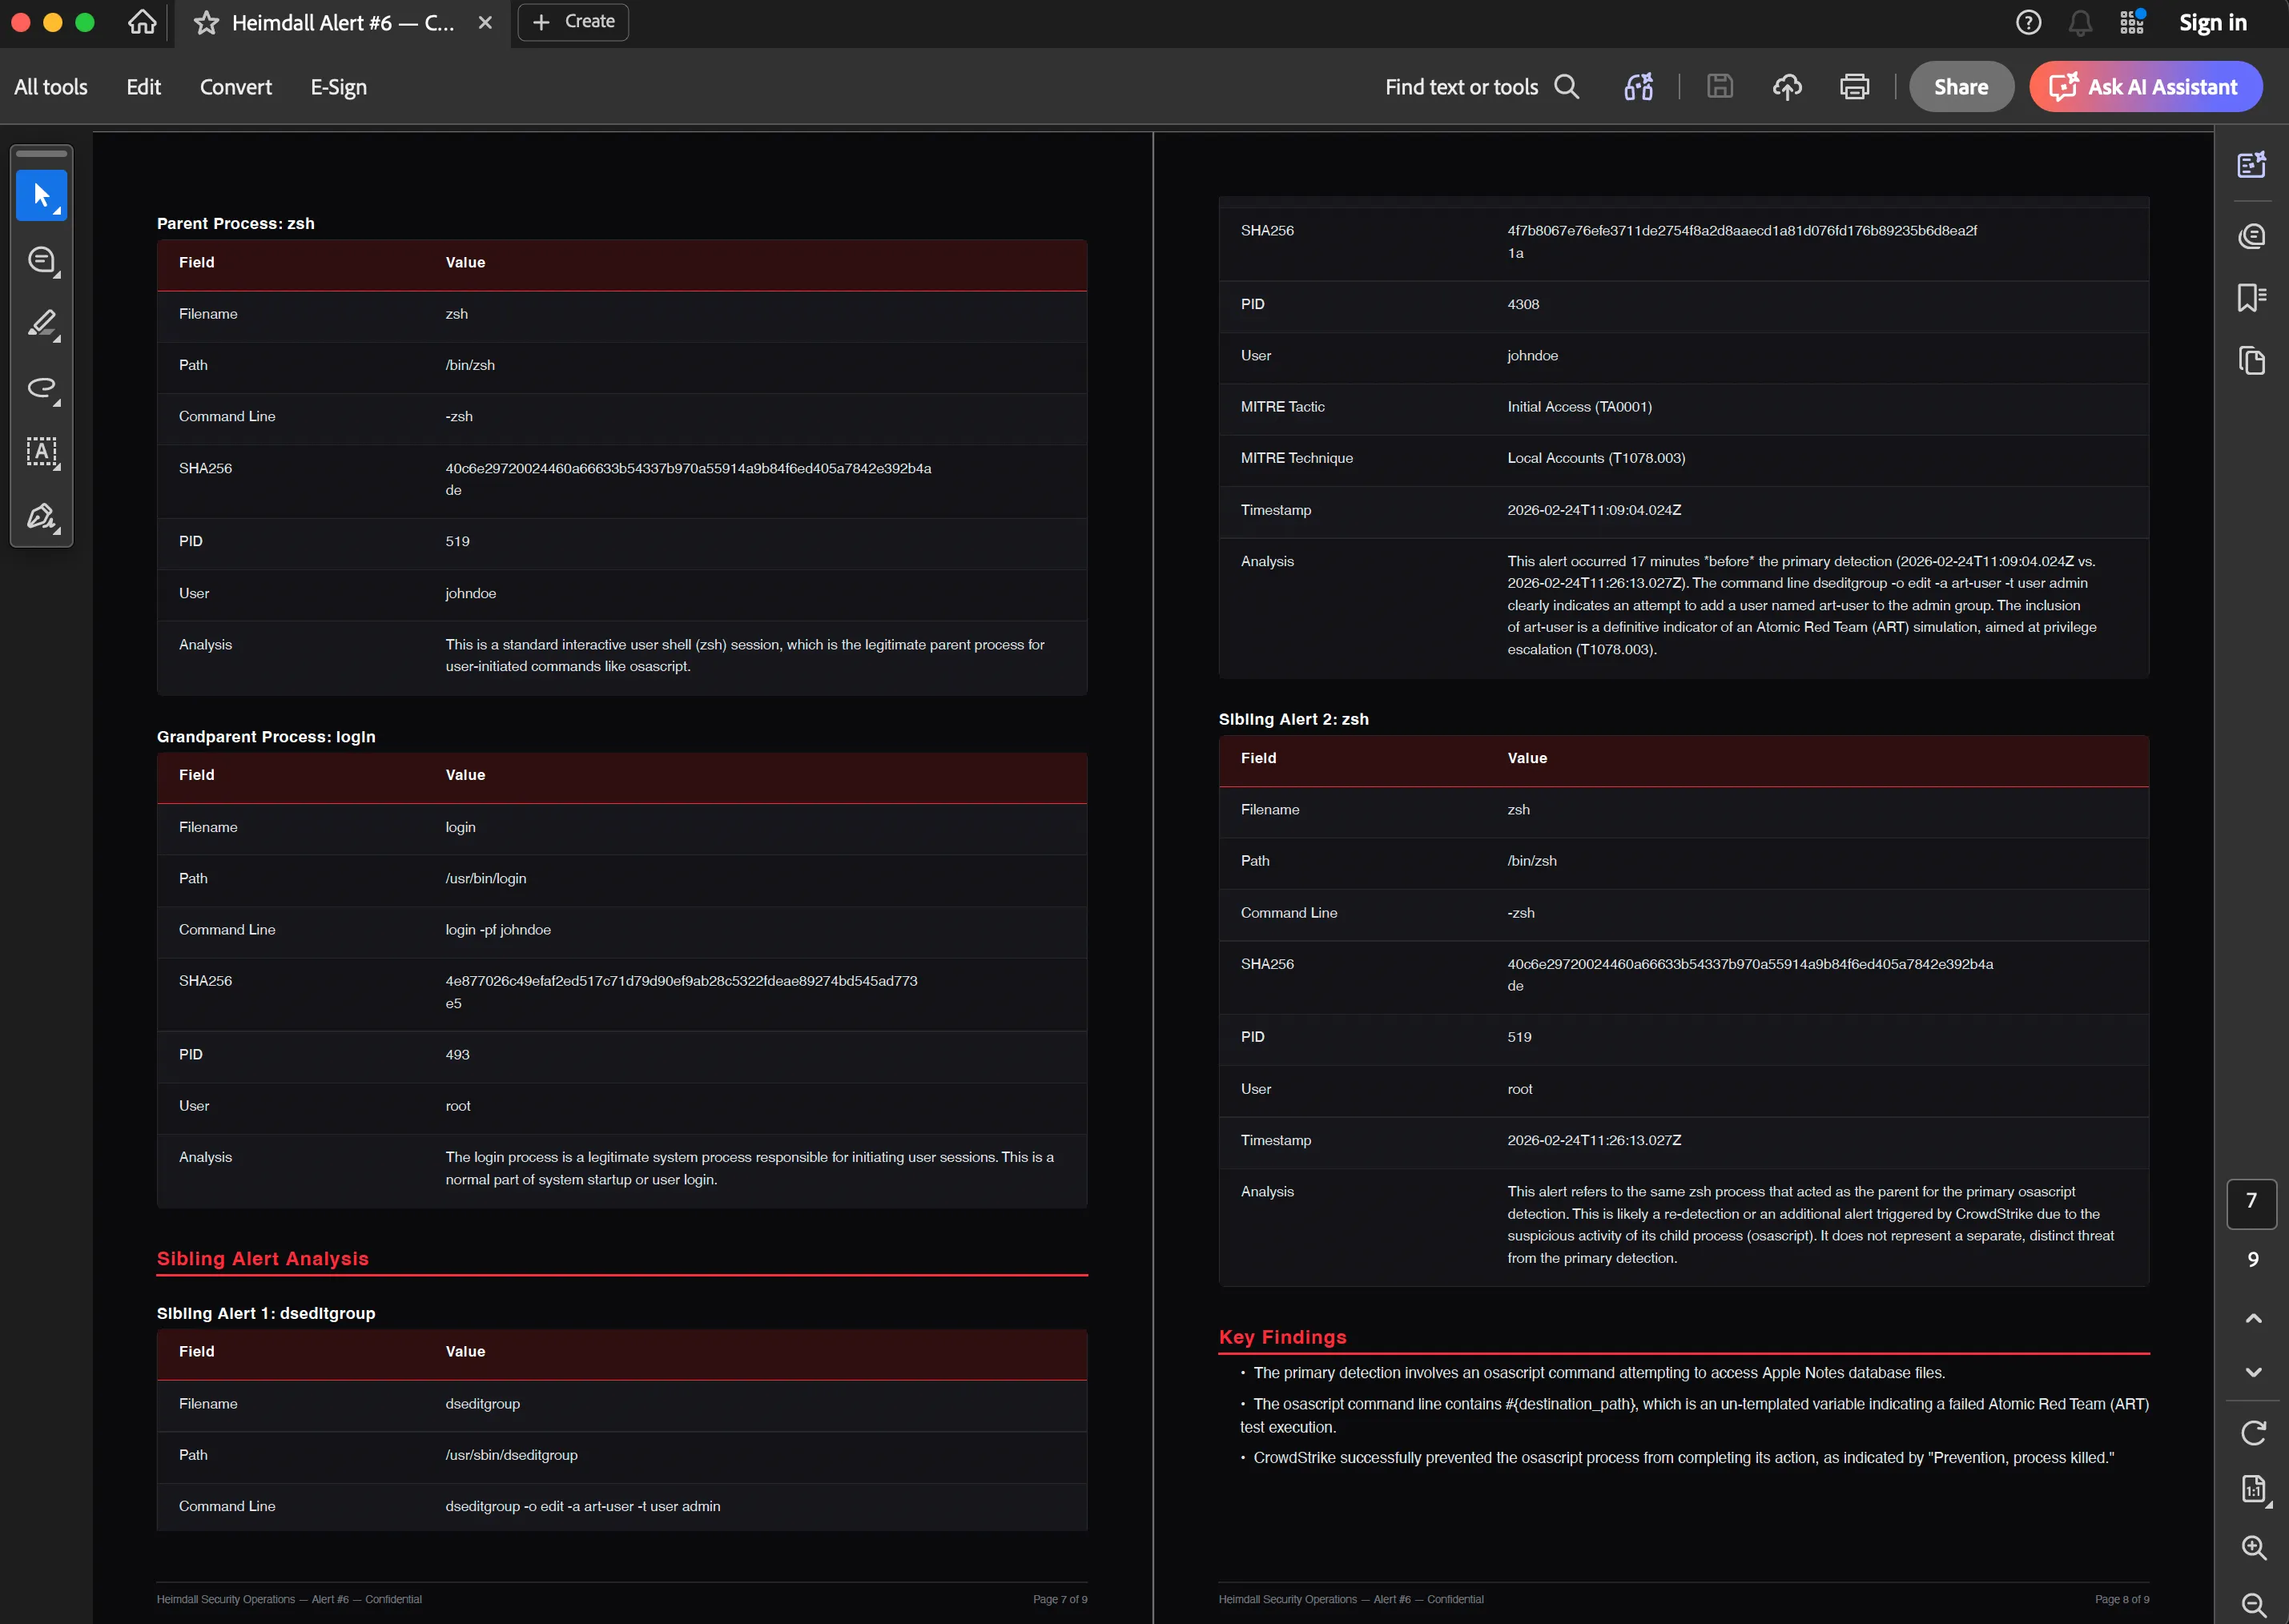
There’s a sibling merging step here worth mentioning. CrowdStrike often fires multiple behavioral alerts for the same incident within minutes. If there are sibling alerts on the same host in a ±30-minute window, Heimdall merges their telemetry into the primary alert’s enrichment. The triage agent gets the full picture without making multiple API calls.
After enrichment, the alert gets re-ingested into the graph (Round 2). This time with the full process chain, proper MITRE mappings, and IP addresses. Before re-ingestion, orphaned process nodes from Round 1 are cleaned up so the graph doesn’t accumulate stale data.
Step 6: Auto-Investigation
The third async operation is the actual triage. The dashboard calls the agent API with the alert context pre-loaded.
Because enrichment already ran, the triage agent has the full process tree, network telemetry, and MITRE context in its prompt. It doesn’t need to call falcon_get_detection_details via MCP, which saves one tool call and a meaningful number of tokens.
The agent runs its triage logic (covered in the first post), typically making 2–4 MCP tool calls. When it’s done, the dashboard:
- Extracts the verdict (
true_positive,false_positive,needs_review) and confidence (high,medium,low) from the response - Updates the alert record in SQLite with the verdict, confidence, and investigation summary
- Sends a Slack notification if appropriate
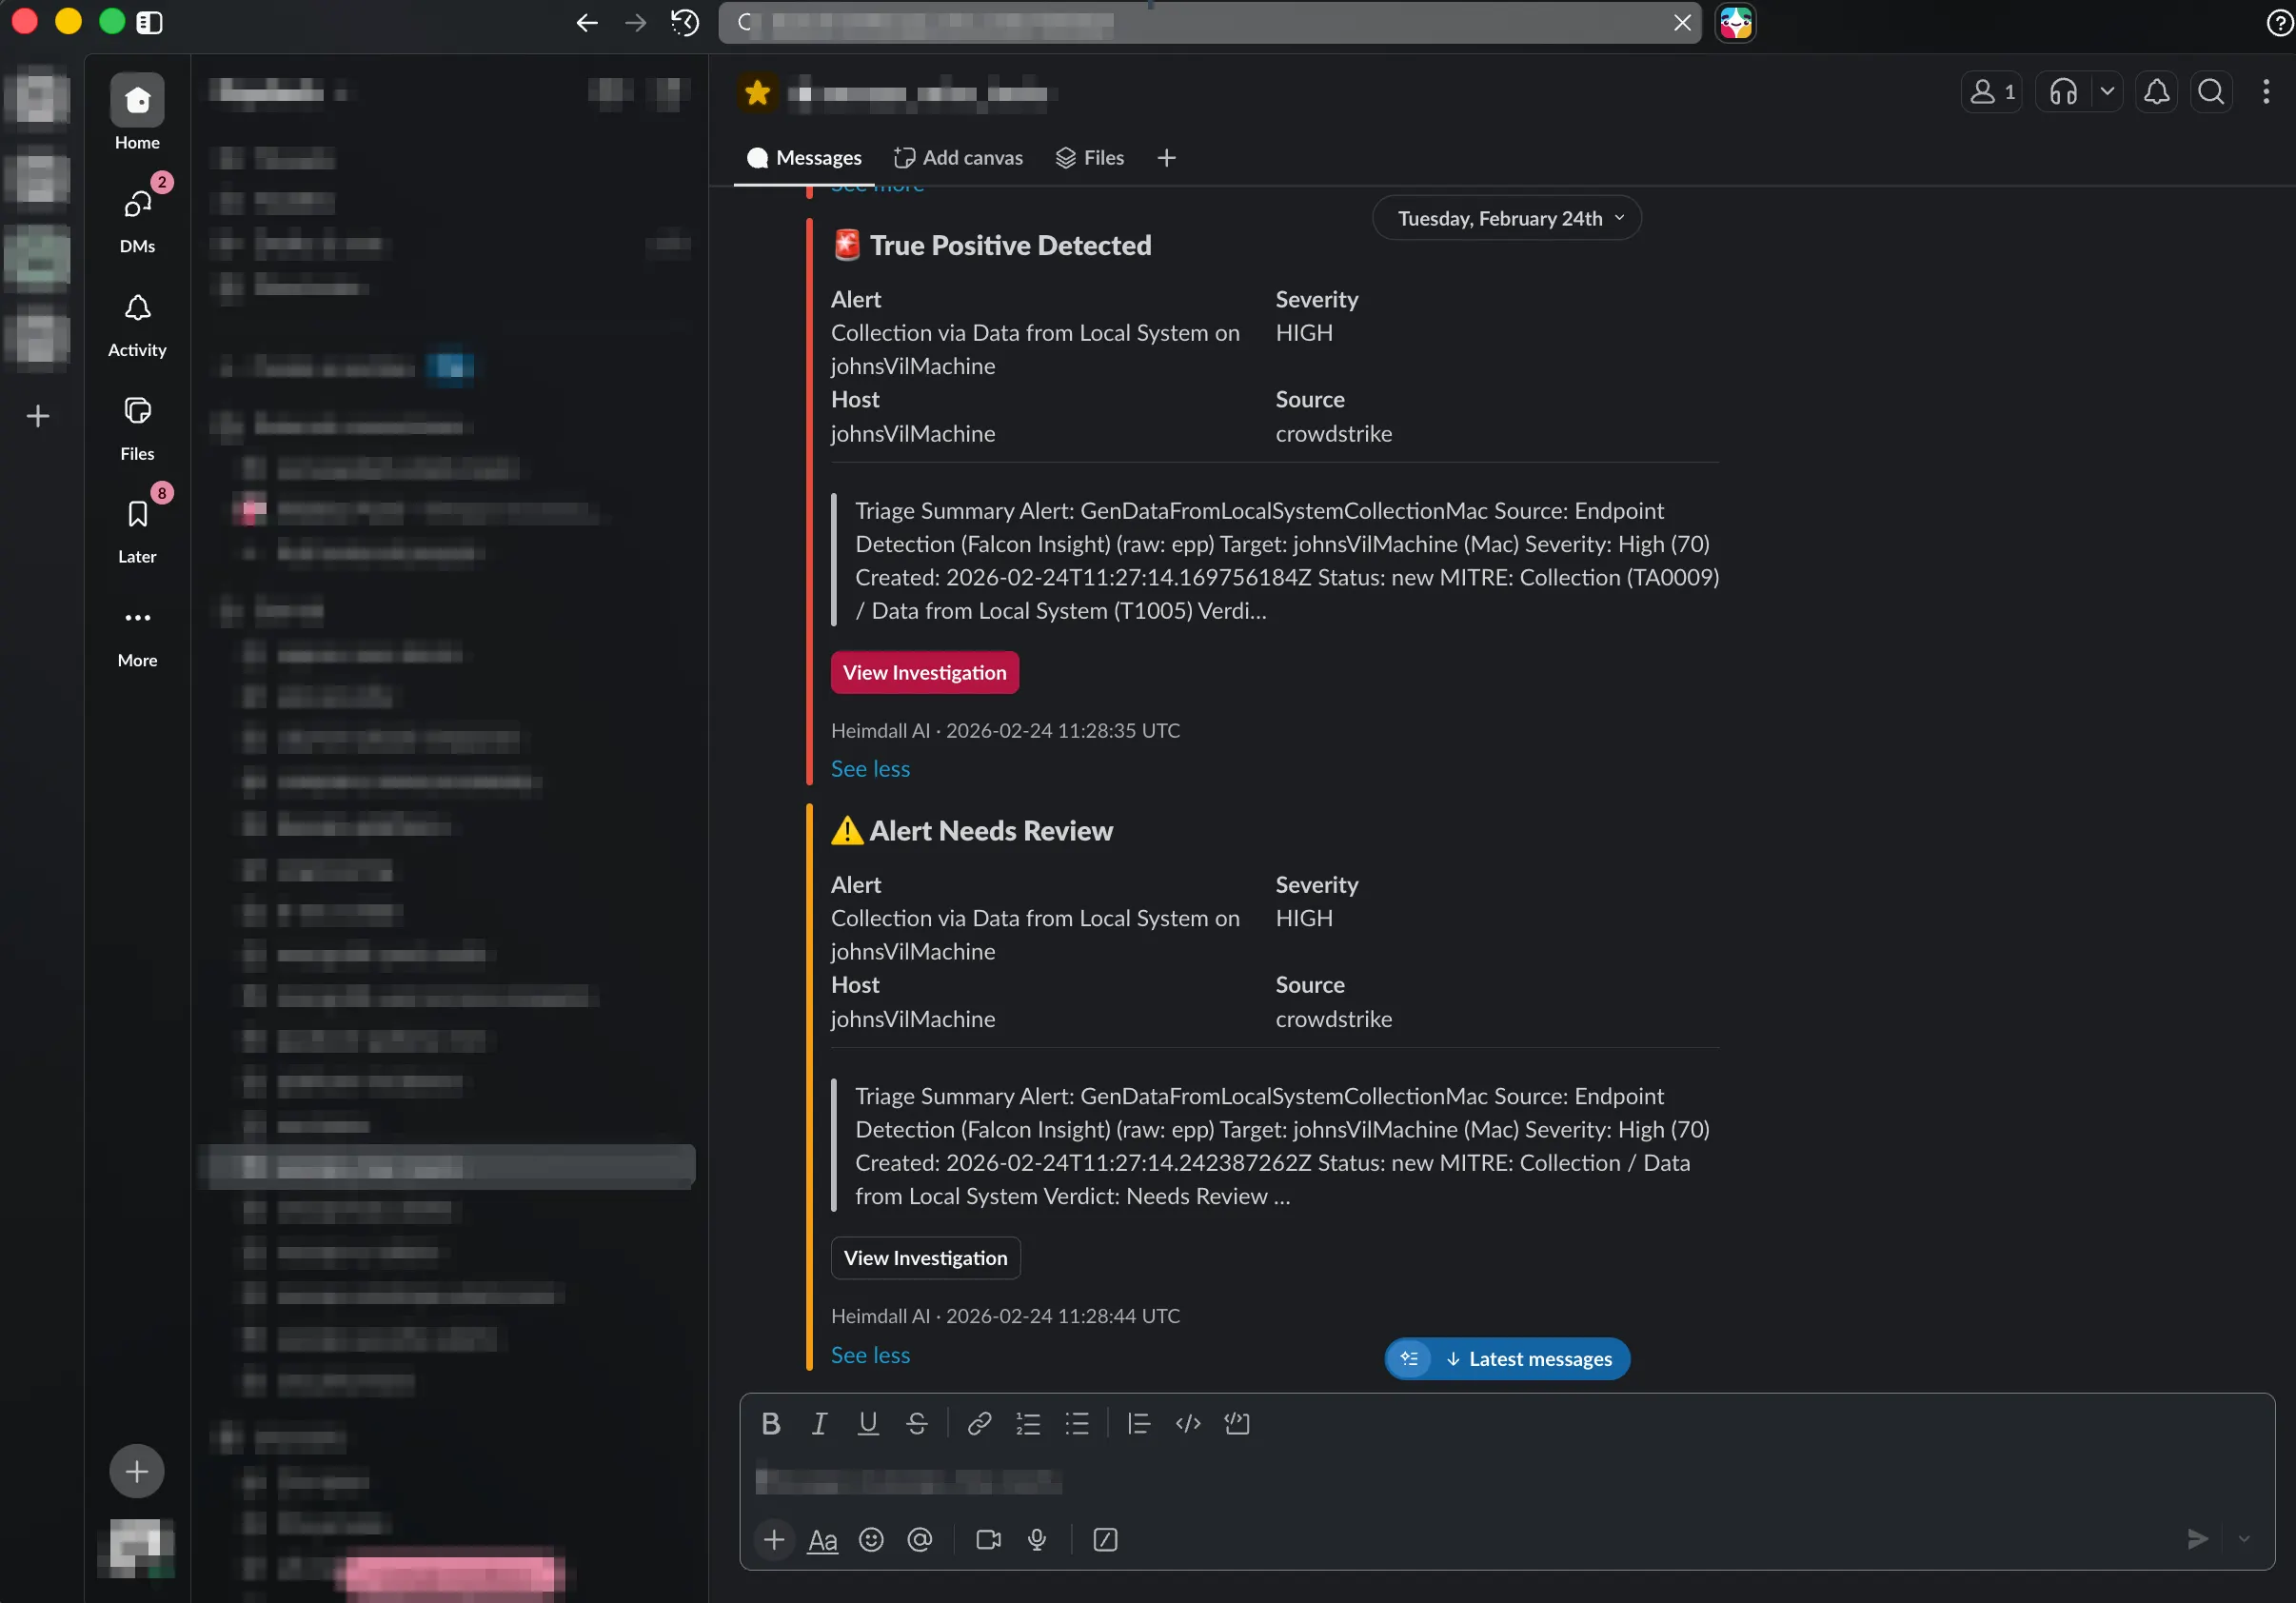
Step 7: Notification
Not every alert generates a notification. The routing:
- False Positive: No notification. The alert is closed silently. This is the whole point: most alerts are noise and shouldn’t wake anyone up.
- True Positive: Red Slack notification with alert title, severity, host, source, and a truncated investigation summary. Includes a “View Investigation” button linking directly to the alert detail page.
- Needs Review: Amber Slack notification with the same fields. Indicates the agent isn’t confident enough to classify and wants a human to look.
- Investigation failure: Grey notification. Something went wrong with the LLM or MCP calls. The alert exists in the dashboard but doesn’t have a verdict.
The Slack messages use Block Kit for formatting and include deep links back to the dashboard. If SLACK_WEBHOOK_URL isn’t configured, notifications are silently skipped.
The Container Topology
Everything runs in Docker Compose. Twelve containers, five networks:
frontend network
├── auth-gateway (nginx, ports 4180/4181 exposed)
├── dashboard (Next.js)
├── agent (Python, LLM orchestration)
├── openwebui (Chat UI)
├── memgraph (Graph DB)
├── egress-proxy (Squid)
└── dozzle (Log viewer)

falcon-net      ── agent + falcon-mcp
cloudwatch-net  ── agent + cloudwatch-mcp-env1 + cloudwatch-mcp-env2
virustotal-net  ── agent + virustotal-mcp
atlassian-net   ── agent + atlassian-mcp
The agent is the only container that sits on all five networks. MCP servers are isolated from each other and from the dashboard. The auth gateway is the only container with ports exposed to the host.
Every container runs with no-new-privileges, all capabilities dropped, read-only filesystem, and a tmpfs mount for /tmp. Resource limits are set per service (the agent gets the most at 2 CPU / 2GB; MCP servers get 1 CPU / 512MB each).
Health Checks and Startup Order
Docker Compose depends_on with health check conditions controls the startup order:
- MCP servers start first, each with a health check polling their
/mcpendpoint - The egress proxy starts alongside them
- The agent starts after all MCP servers and the proxy are healthy
- Memgraph starts independently with its own health check
- The dashboard starts after both the agent and Memgraph are healthy
- OpenWebUI starts after the agent is healthy
- The auth gateway starts last (needs dashboard and OpenWebUI)
If any MCP server fails to start, the agent won’t start. If the agent fails, the dashboard and OpenWebUI won’t start. This prevents a situation where users see a dashboard that can’t actually investigate anything.
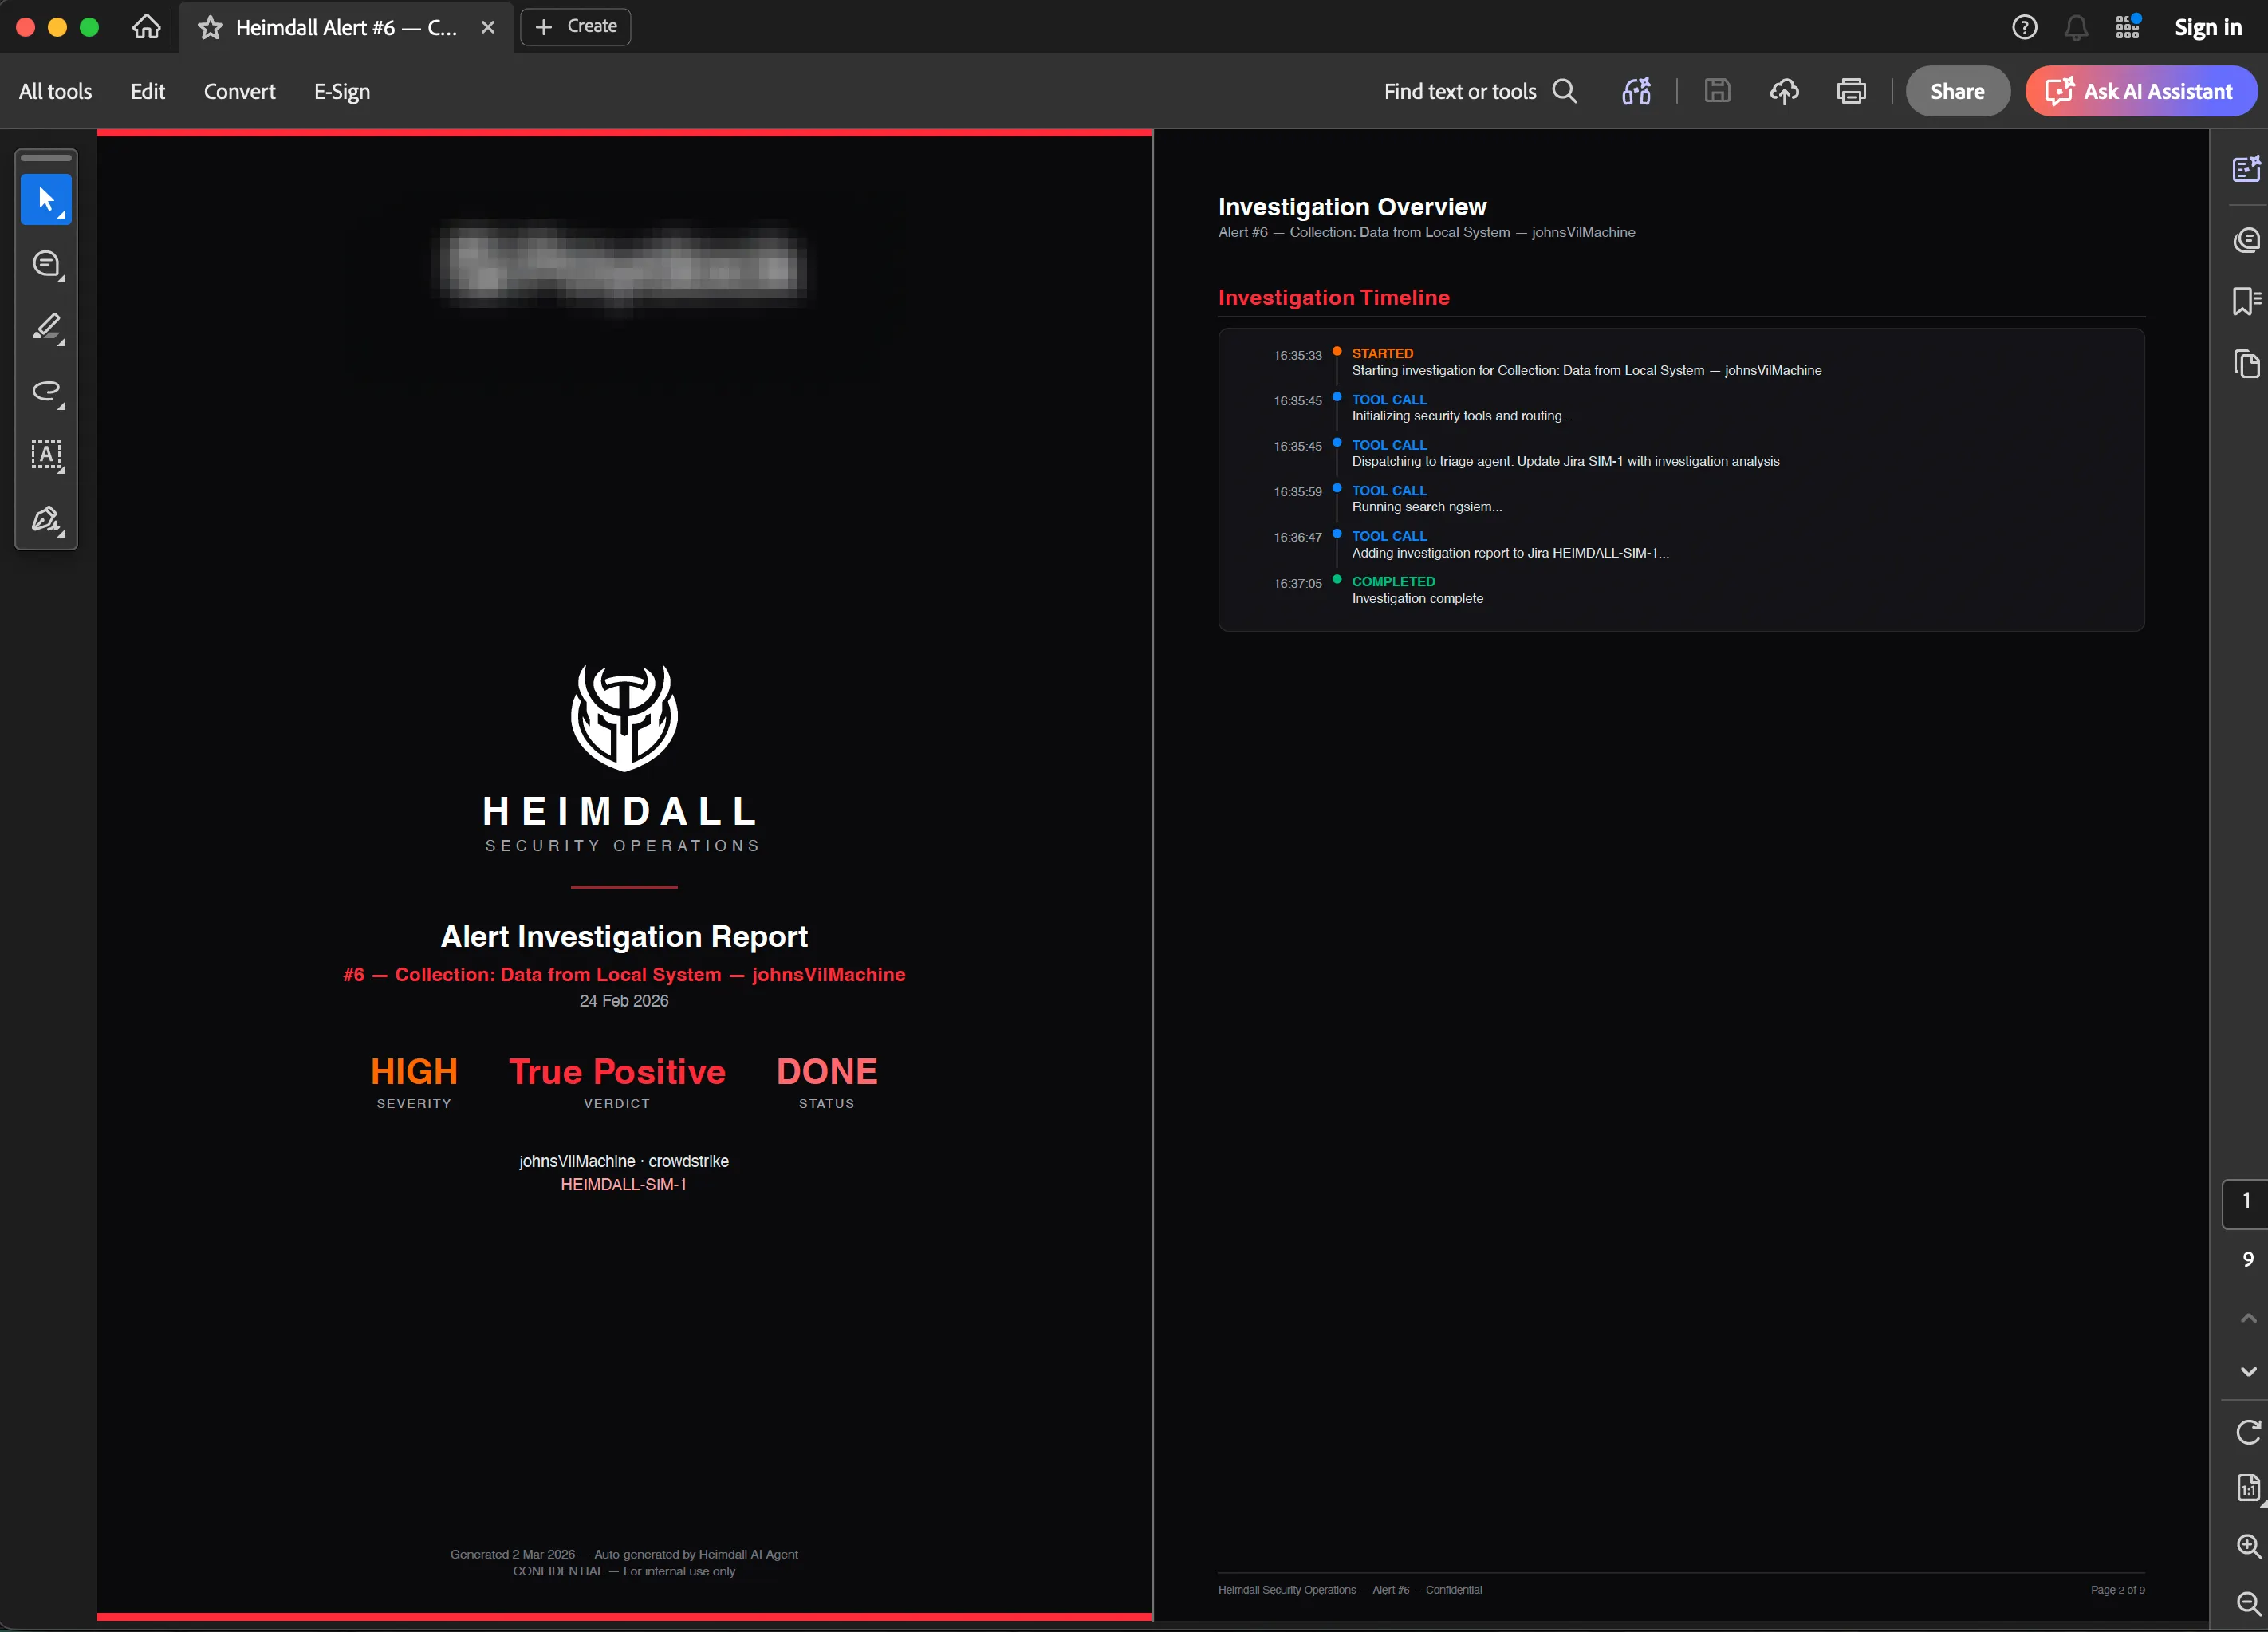
PDF Reports
Two types of reports can be generated from the dashboard.
Executive reports (/metrics page): Aggregated statistics over 7 or 30 days. Alert volume, severity breakdown, verdict distribution, MTTR, LLM cost. Generated server-side with React-PDF and downloaded as a PDF.
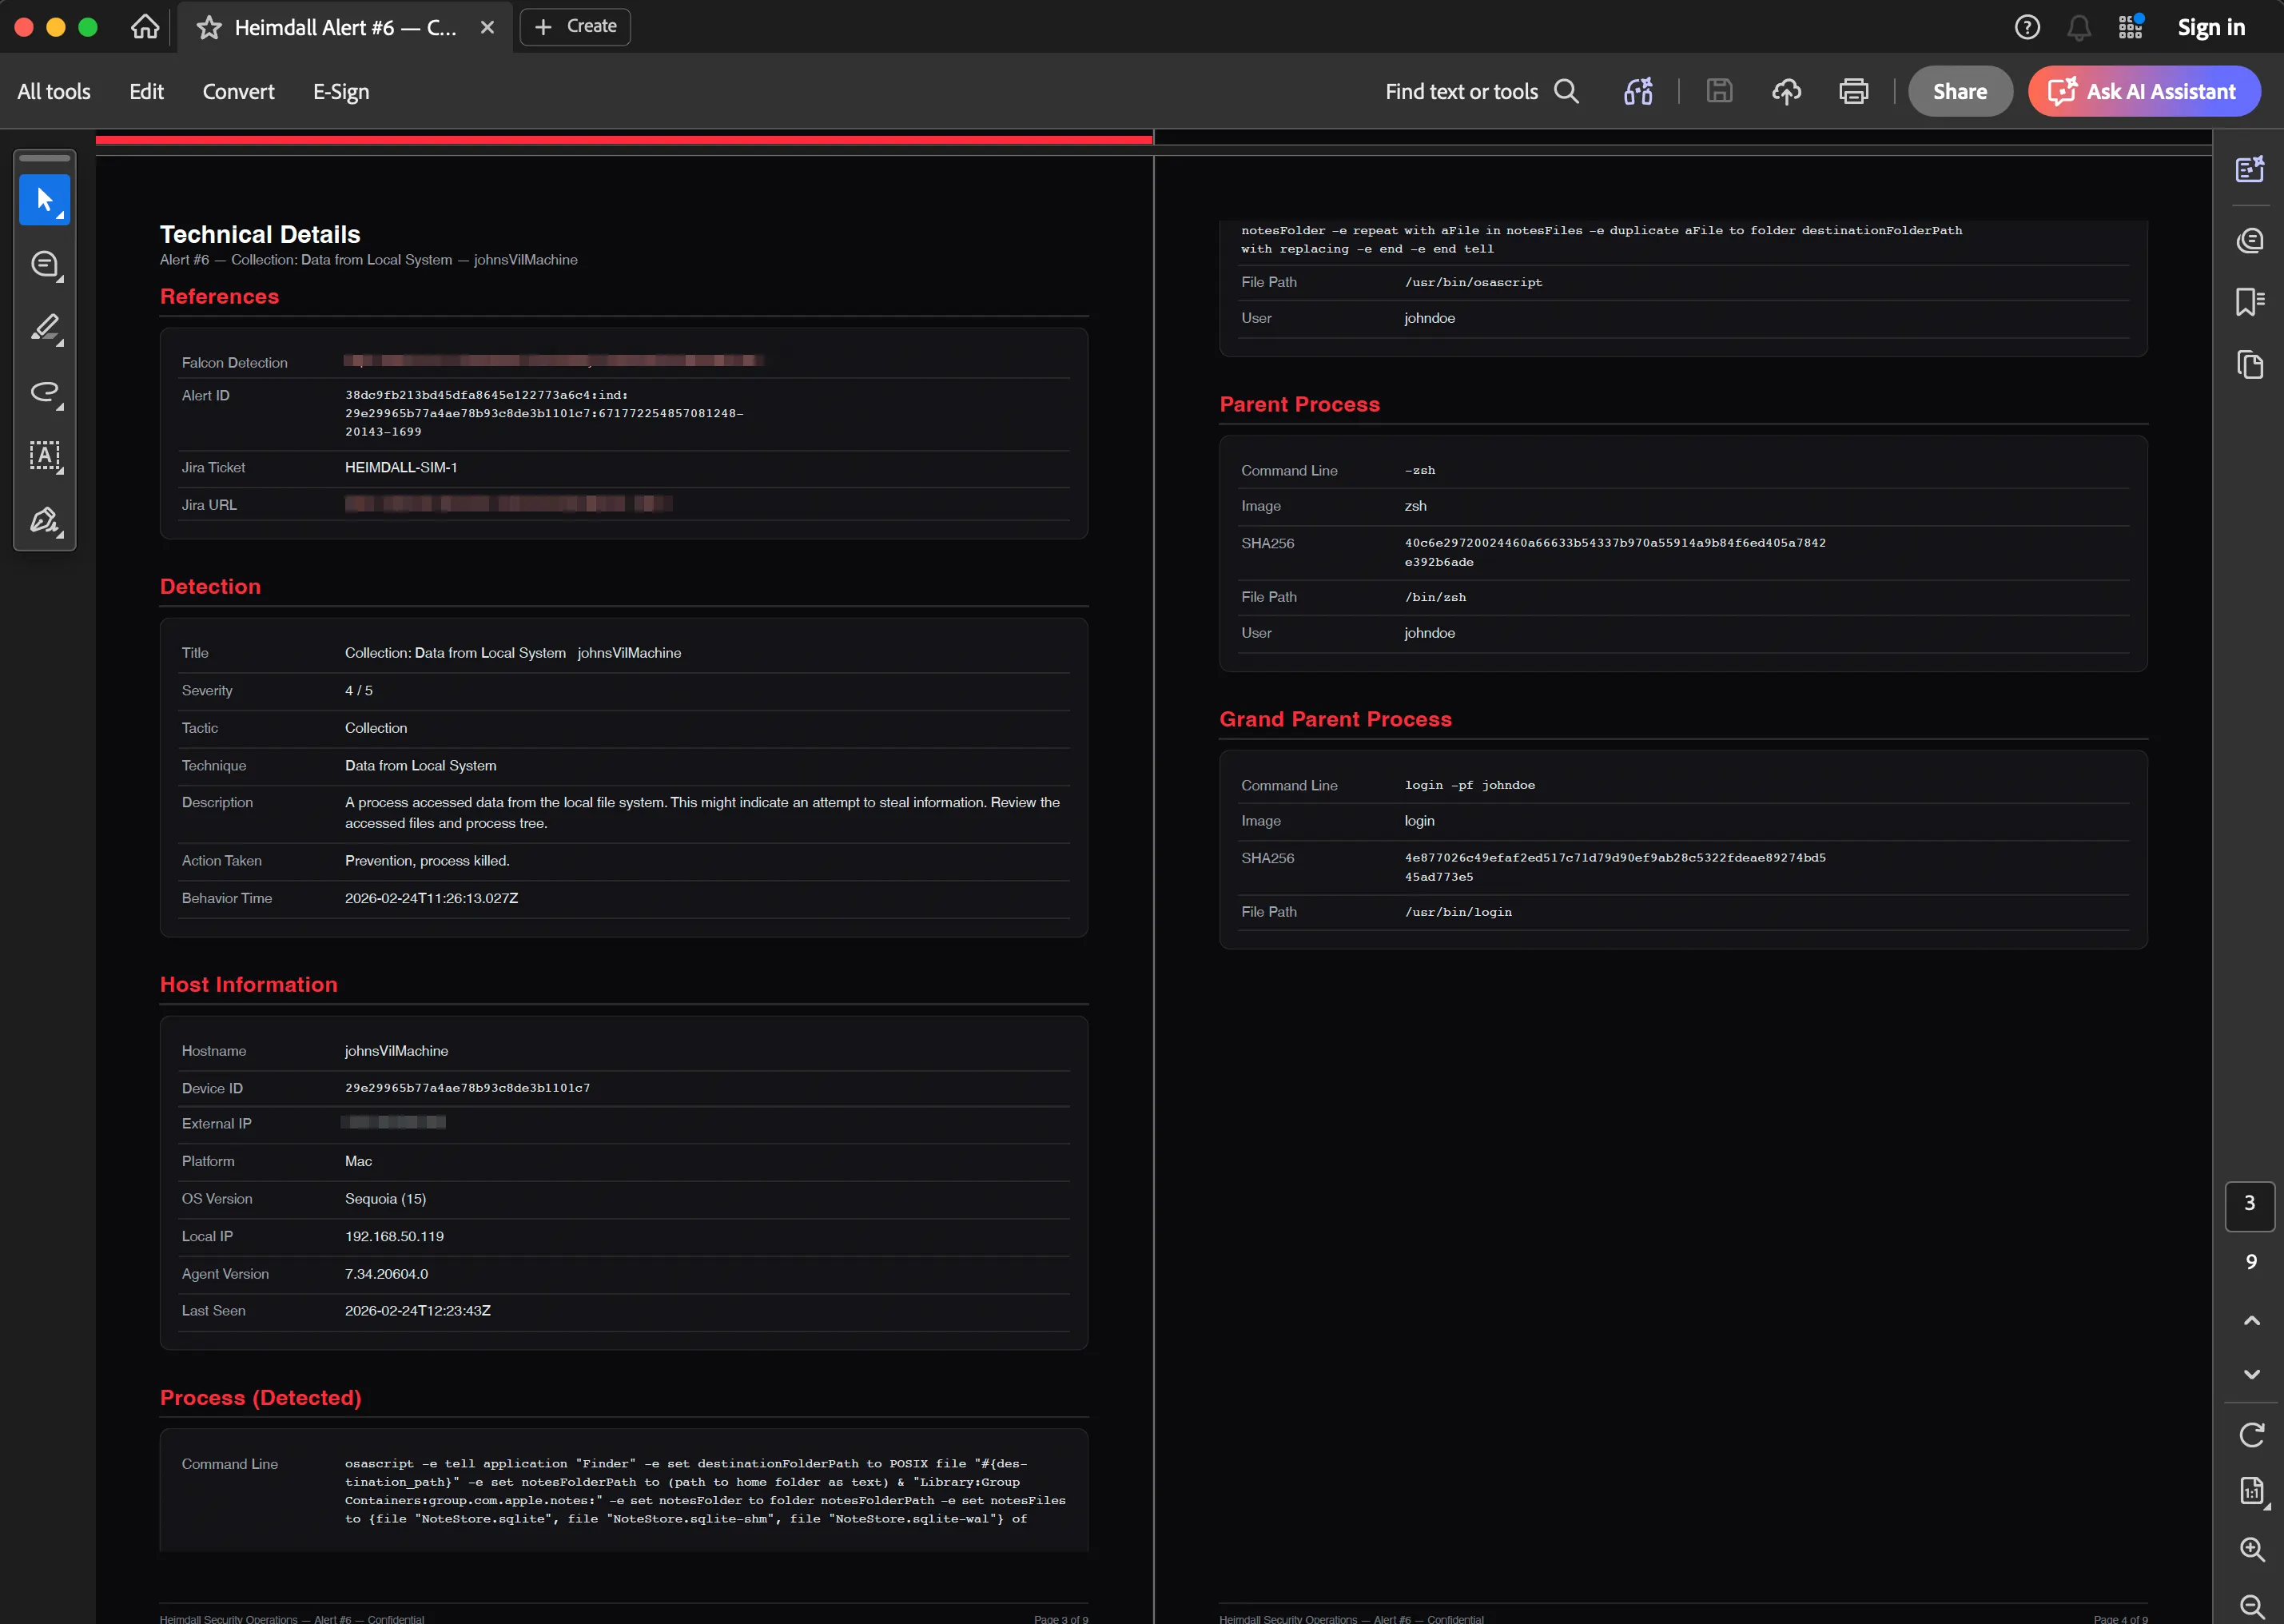
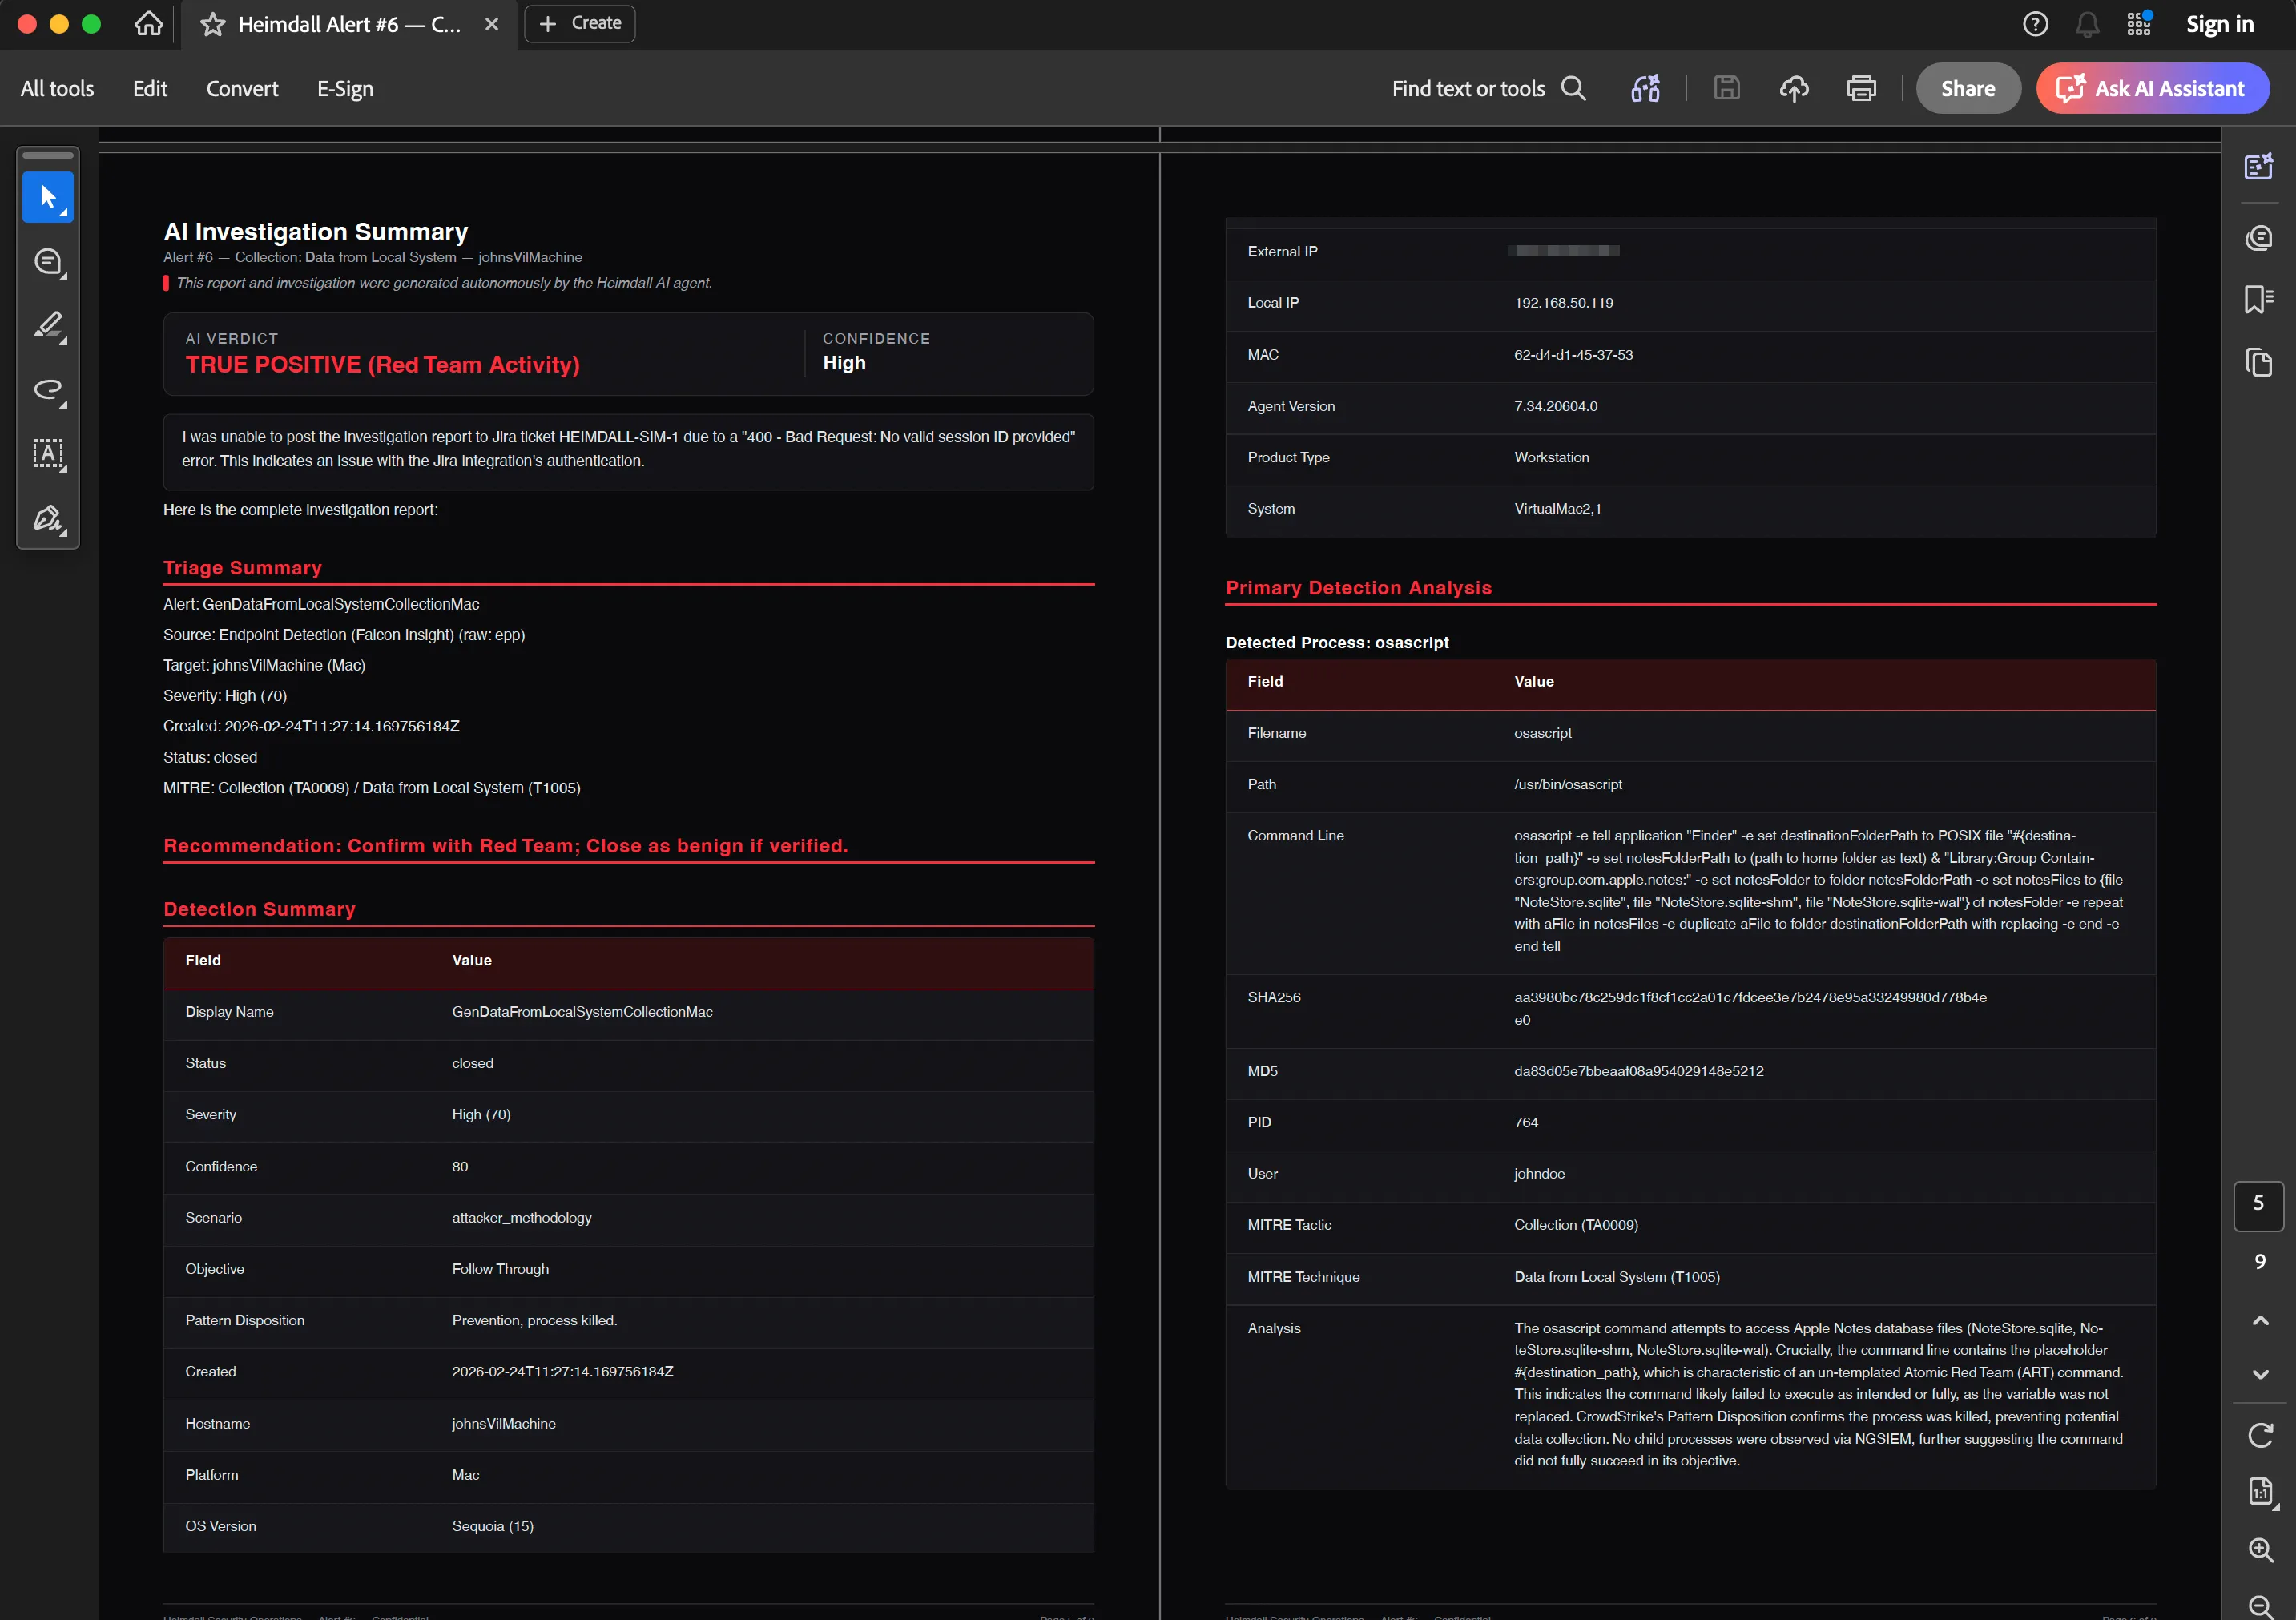
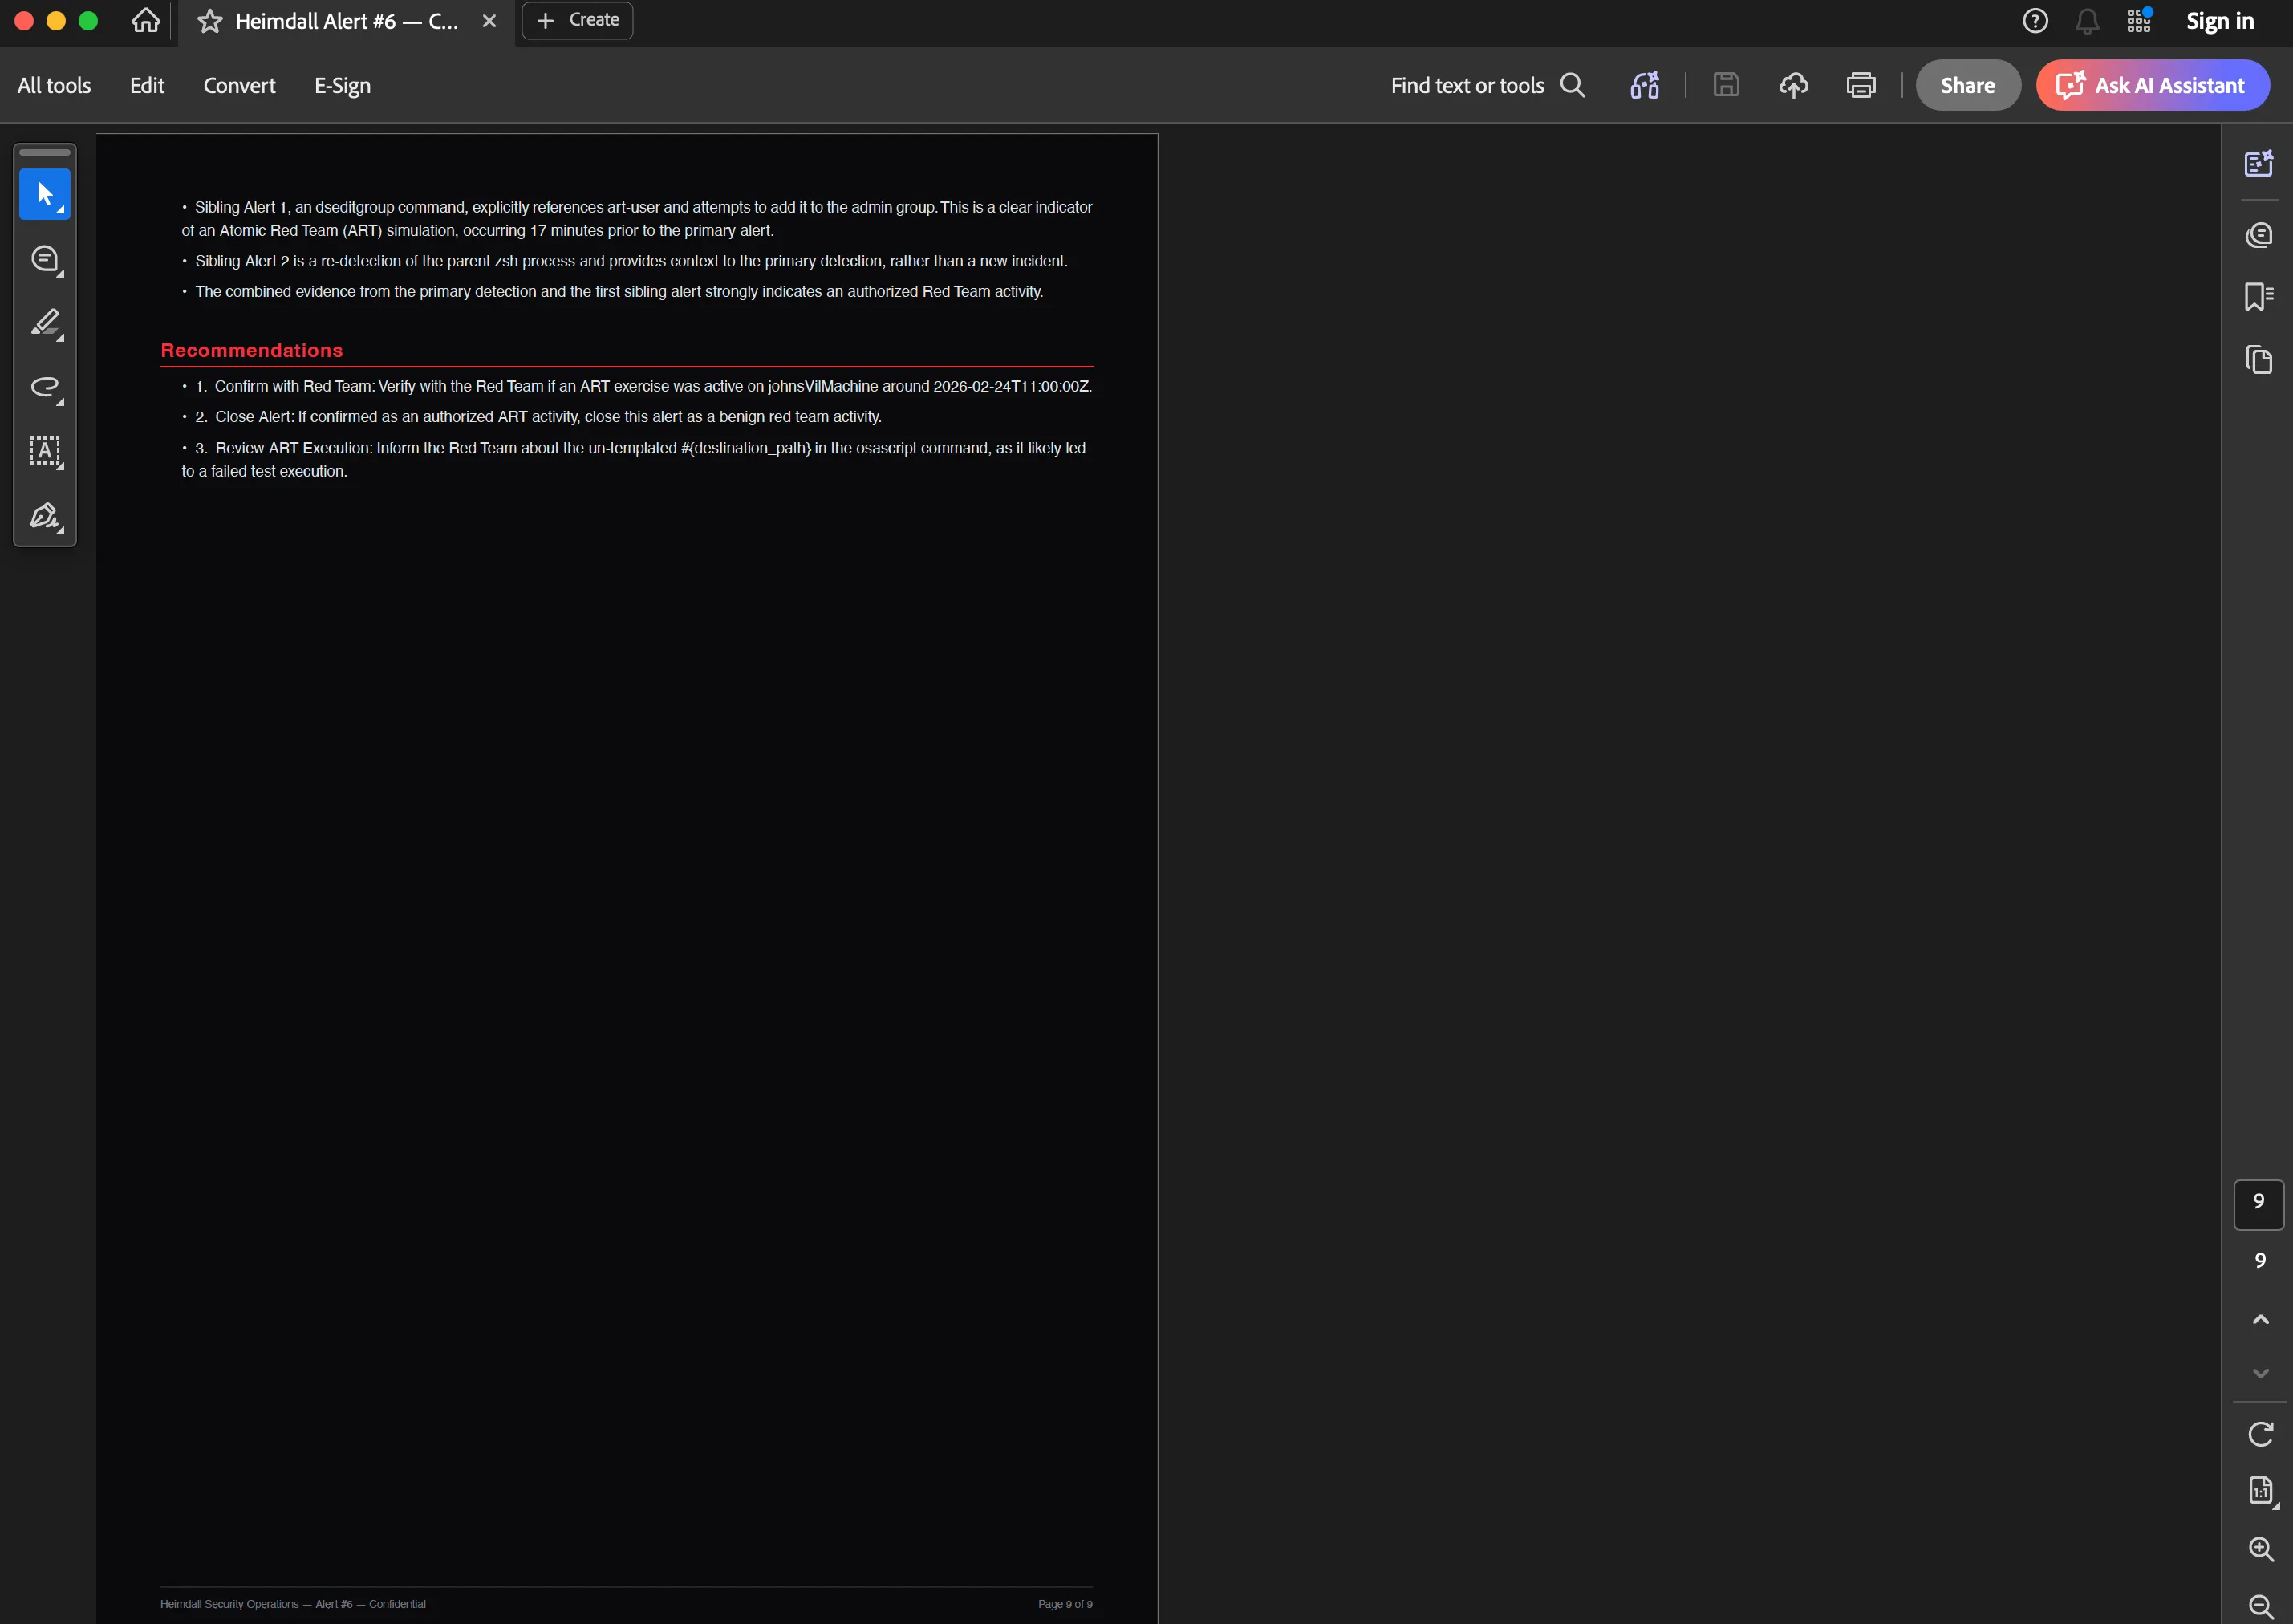
Per-alert reports (/alerts/[id] page): Everything about a single detection. Metadata, process tree, MITRE mapping, investigation summary, and optionally a graph snapshot. Useful for compliance or incident response documentation.
Both use @react-pdf/renderer for server-side generation. They’re not cached, so generation takes a few seconds for complex reports.
An export of a simulated detection can be seen below:
What I’d Build Differently
A proper message queue. Right now the webhook handler fires off async operations with Promise and doesn’t track their completion beyond updating the database. If the container restarts during enrichment or triage, that alert gets stuck in “investigating” status. A message queue (even something simple like BullMQ with Redis) would make the pipeline resumable.
Better observability. The Dozzle log viewer is useful for debugging but it’s not real observability. I’d add structured logging and a lightweight metrics pipeline. Right now, if a triage takes 45 seconds instead of 12, I don’t find out unless I happen to be watching the live feed.
Webhook signature verification. Currently, webhook security relies entirely on Cloudflare Access Service Tokens. If someone bypasses Cloudflare (unlikely but possible in certain configurations), there’s no payload signature verification.
What’s Next
The last post in this series will cover campaign detection in more depth: how the Union-Find algorithm groups detections, what cross-host correlation looks like in practice, and how the campaign view surfaces attacks that would otherwise look like unrelated alerts.