An experimental module that reads 16 threat intelligence feeds, scores them against the tech stack, and auto-generates executable hunt queries, work in progress.
Most security teams consume threat intelligence passively. Someone reads a CISA advisory over coffee, thinks “we should check if that affects us,” and then doesn’t. Or they do, three days later, when the vulnerability is already being exploited in the wild.
I wanted to see what it would look like if that process was automated end-to-end: fetch the advisory, determine if it’s relevant to our specific stack, and produce a ready-to-run hunt query that checks whether we’re exposed. No human in the loop until the results come back.
This is still experimental. I’m toying with the idea more than shipping it, but the pipeline works, and the early results are interesting enough to write about.
The Idea
Heimdall already triages alerts reactively. A CrowdStrike detection fires, a webhook arrives, the triage agent investigates. That’s post-detection. But what about the gap between a vulnerability being published and a detection rule being written? That’s the window where threat intel actually matters, and it’s usually filled with people skimming RSS feeds.
The CTI module flips the direction. Instead of waiting for alerts, it goes looking for trouble:
- Fetch articles from 16 RSS threat intelligence feeds
- Score each article against our specific tech stack
- Filter to what’s actually relevant (not everything is)
- Dispatch the relevant articles to a CTI sub-agent
- Generate findings with impact assessments, remediation steps, and hunt queries
- Execute those hunt queries against Elastic SIEM, CrowdStrike NGSIEM, or CloudWatch
The whole thing runs as a single API call: POST /cti/sweep.
The Feed Registry
The feeds are configured in a YAML file with metadata that drives scoring and prioritisation:
feeds:
  - name: "CISA Advisory Alerts"
    url: "https://www.cisa.gov/cybersecurity-advisories/alerts.xml"
    priority: critical
    weight: 10
    reliability: 0.95
    category: government

  - name: "CrowdStrike Blog"
    url: "https://www.crowdstrike.com/en-us/blog/feed/"
    priority: high
    weight: 9
    reliability: 0.90
    category: threat_intelligence

  # ... 14 more feeds
There are 16 feeds total across five categories:
- Government / Authoritative - CISA, NIST - weight 9–10
- Threat Intelligence Vendors - CrowdStrike, Cisco Talos, Microsoft MSRC - weight 8–9
- Research / Investigative - Krebs, Schneier, SANS ISC - weight 8–9
- Industry News - The Hacker News, Dark Reading, Threatpost, InfoSec Magazine - weight 6–8
- Vendor Blogs - ESET, Malwarebytes, Level Blue, Graham Cluley - weight 6–7
Each feed has a reliability score (0.80–0.95) and a weight (1–10) that factor into the composite scoring later. The idea is that a CISA advisory about an actively exploited CVE should rank higher than a Dark Reading article about a theoretical attack.
Feeds are fetched concurrently (up to 8 at a time) with a 24-hour lookback window. Articles older than that are dropped. The fetcher de-duplicates by content hash (SHA-256 of title + link) so the same article from syndicated sources doesn’t get scored twice.
The Scoring Engine
This is where it gets interesting. Fetching 16 RSS feeds gives you maybe 200 articles a day. Most of them are irrelevant to our environment. The scoring engine’s job is to separate “Linux kernel zero-day” (relevant) from “Windows Active Directory vulnerability” (not relevant, as we don’t run Windows servers).
Scoring has two dimensions.
Threat Score - How severe is the threat itself? The engine matches articles against a keyword dictionary with weighted terms:
- Critical keywords (score 7+): zero-day, actively exploited, remote code execution, supply chain compromise
- High keywords (score 4–6): CVE, ransomware, privilege escalation, lateral movement
- Medium keywords (score 2–3): vulnerability, phishing, credential theft
- Low keywords (score 1): advisory, awareness, best practice
Relevance Score - Does it affect technology we actually run? This is scored against a configurable tech stack definition:
tech_stack:
  tier_1_critical:
    - name: "Kubernetes"
      aliases: ["k8s", "EKS", "Amazon EKS"]
      weight: 10
    - name: "CrowdStrike Falcon"
      aliases: ["Falcon sensor", "CrowdStrike EDR"]
      weight: 9
  tier_2_important:
    - name: "Nginx"
      aliases: ["nginx ingress", "ingress-nginx"]
      weight: 7
    - name: "ArgoCD"
      aliases: ["Argo CD", "gitops"]
      weight: 7
    # ...
The composite score is (threat_score + relevance_score) × source_reliability. An article has to match at least one tech-stack entry to be considered relevant at all. This single filter typically drops 80–90% of articles.
The Sweep Pipeline
When you trigger a sweep, here’s what happens:
POST /cti/sweep
     │
     ▼
Fetch 16 RSS feeds (concurrent, 24h lookback)
     │
     ▼
Score articles (threat keywords × tech-stack relevance)
     │
     ▼
Filter: drop articles with zero tech-stack matches
     │
     ▼
Dedup: skip articles already seen in previous sweeps
     │
     ▼
Build task: group by severity, attach metadata
     │
     ▼
Dispatch to CTI sub-agent (LLM)
     │
     ▼
Parse response: extract findings + hunt proposals
     │
     ▼
Store: findings → SQLite, hunts → SQLite (status: "proposed")
The CTI sub-agent isn’t just summarising articles. It has full context about our environment: which AWS accounts we run, which Elastic indices exist, which Falco rules are deployed, which NGSIEM event types are available. Its system prompt includes concrete field references for every data source so the hunt queries it generates are syntactically valid.
The agent also has tool access. If an article mentions a specific CVE, it can call falcon_search_vulnerabilities to check whether our endpoints are exposed. If a threat actor is named, it can pull their profile from falcon_search_actors. If IOCs are mentioned (hashes, IPs, domains), it can check them against VirusTotal. But it’s budgeted to 8 tool calls per sweep, so it has to prioritise.
Hunt Generation
The part I find most interesting is the hunt output. The CTI agent doesn’t just produce a briefing. It proposes executable queries mapped to the right data source.
Each proposed hunt gets stored with a status of proposed. From there you can:
- Review it on the dashboard
- Edit the query if the LLM got something slightly wrong
- Execute it - this dispatches the query to the hunt sub-agent, which runs it against the actual SIEM and reports back
- Dismiss it if it’s not worth running
The execute flow is a two-agent chain: the CTI agent wrote the query, and the hunt agent runs it. The hunt agent has its own tool access and can iterate on the query if the first attempt returns nothing useful.
Original article from THN available here.
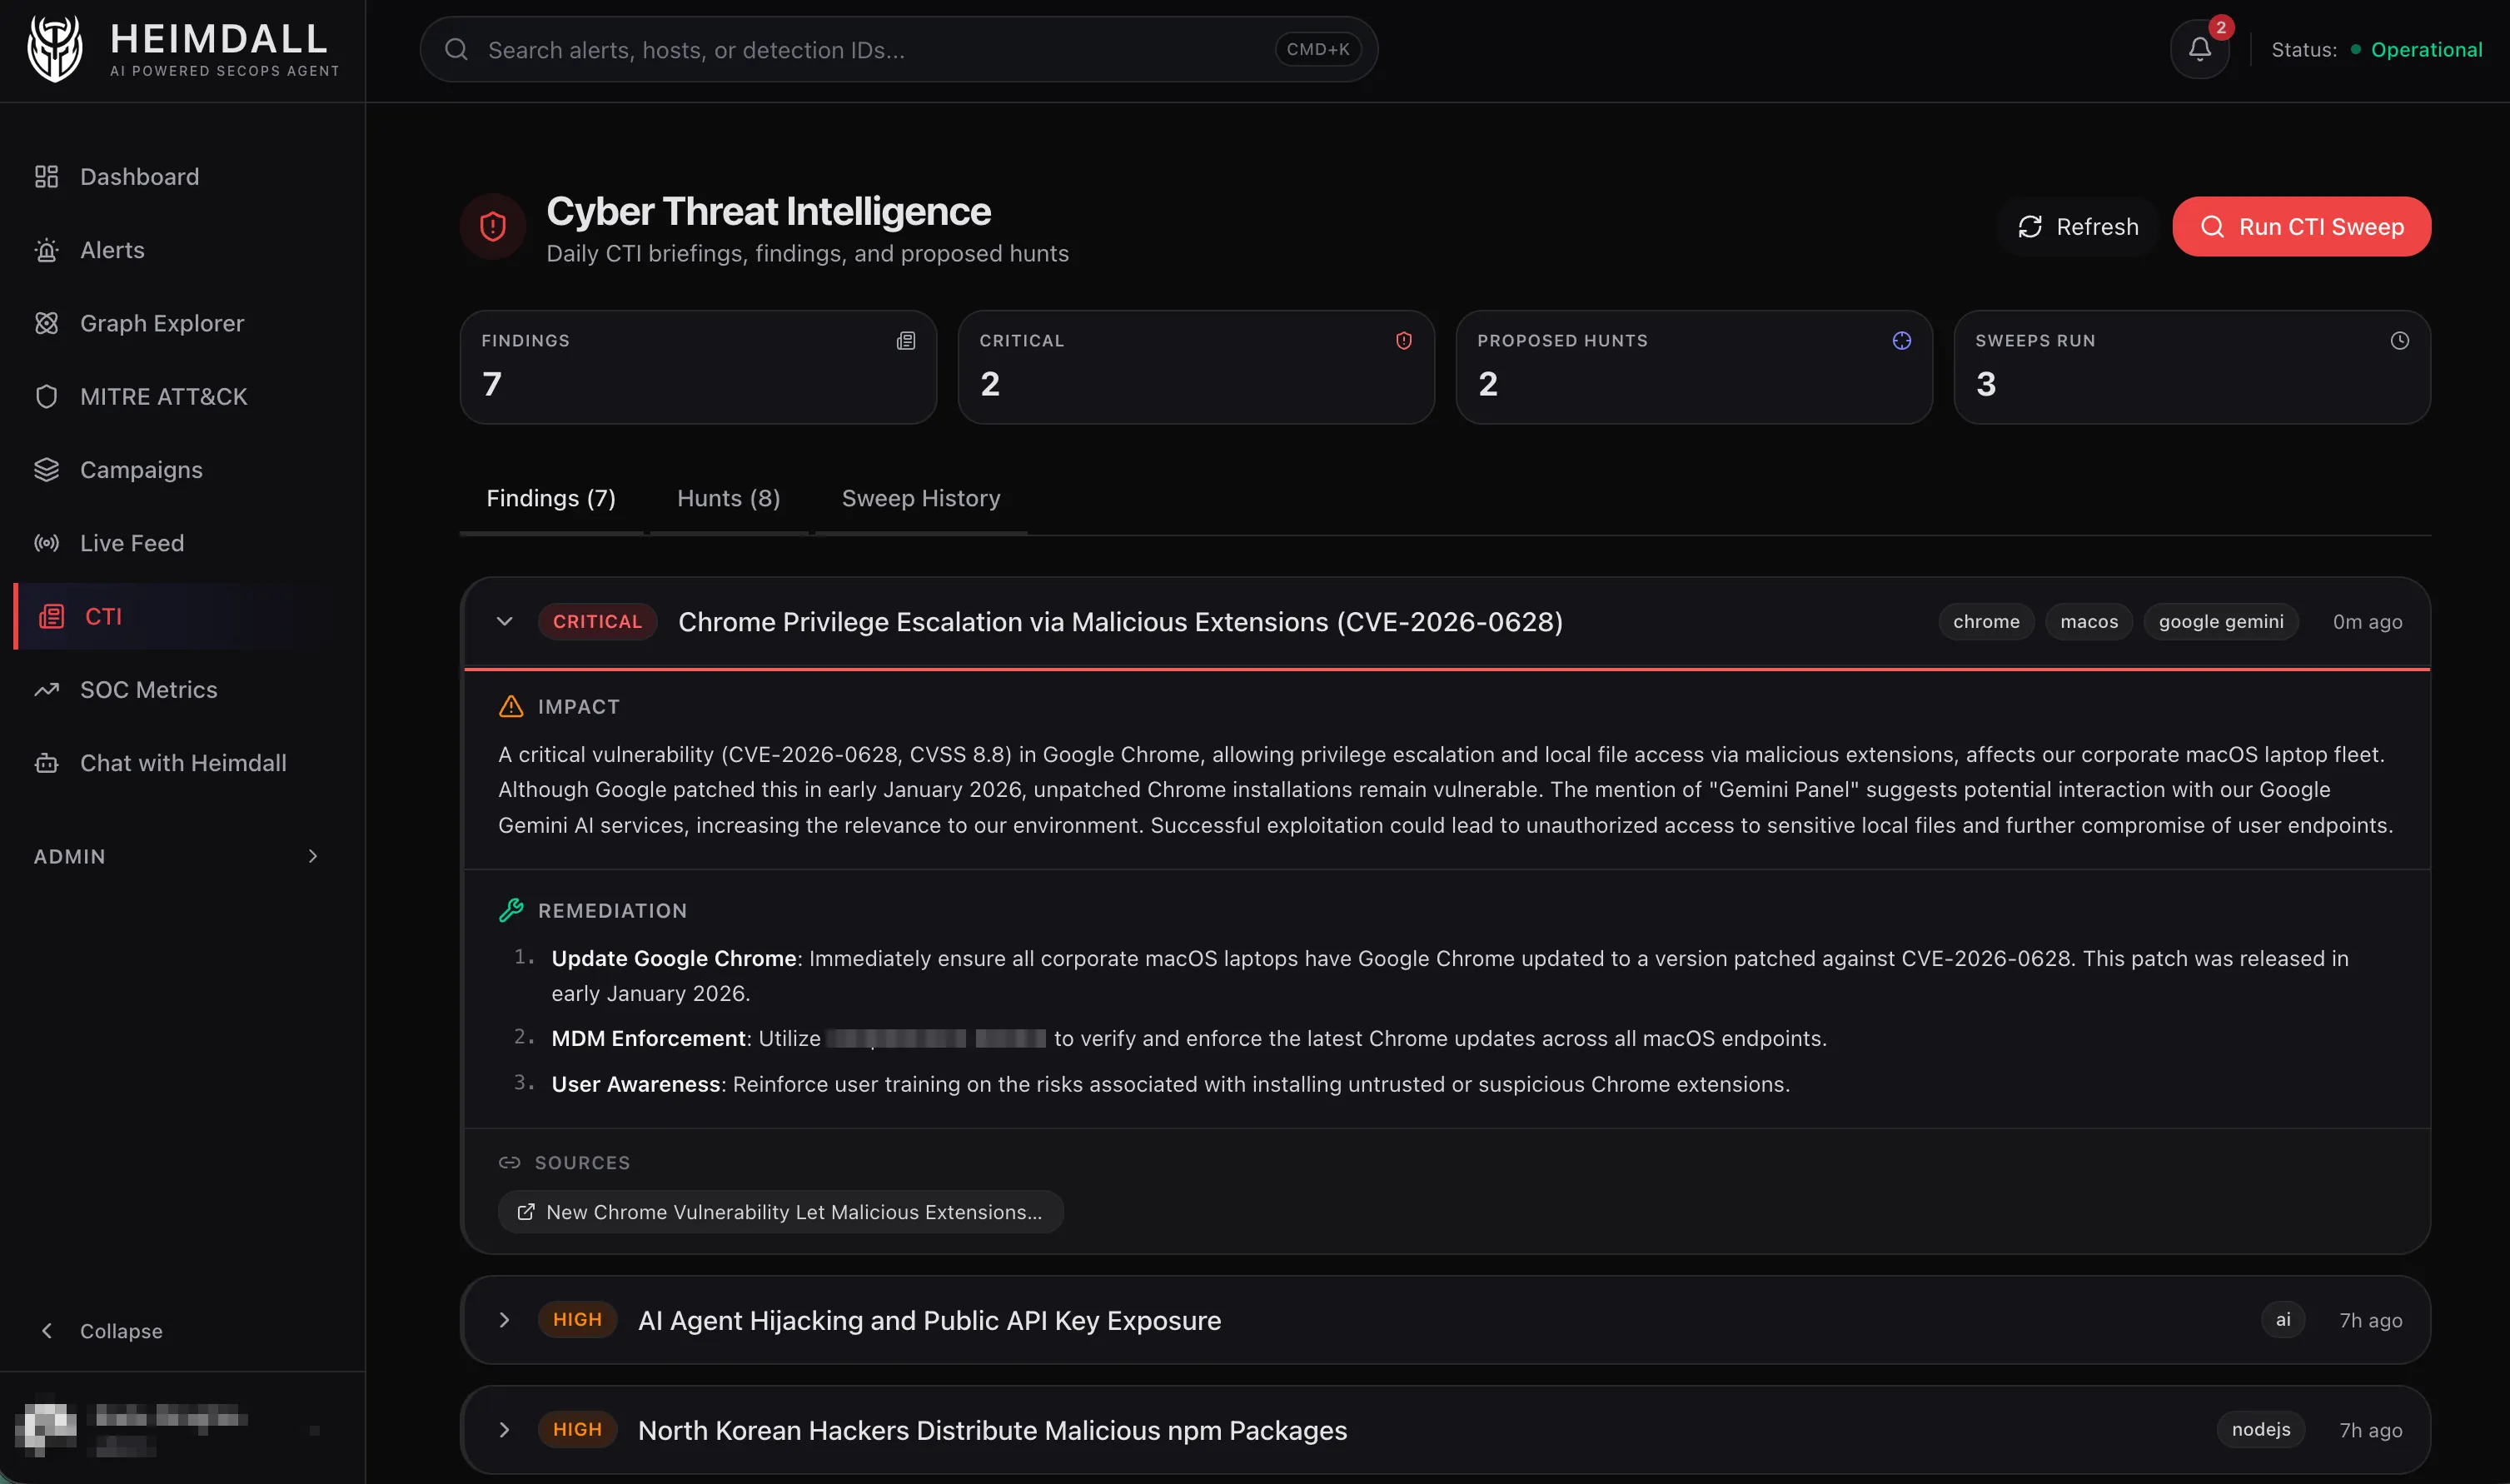
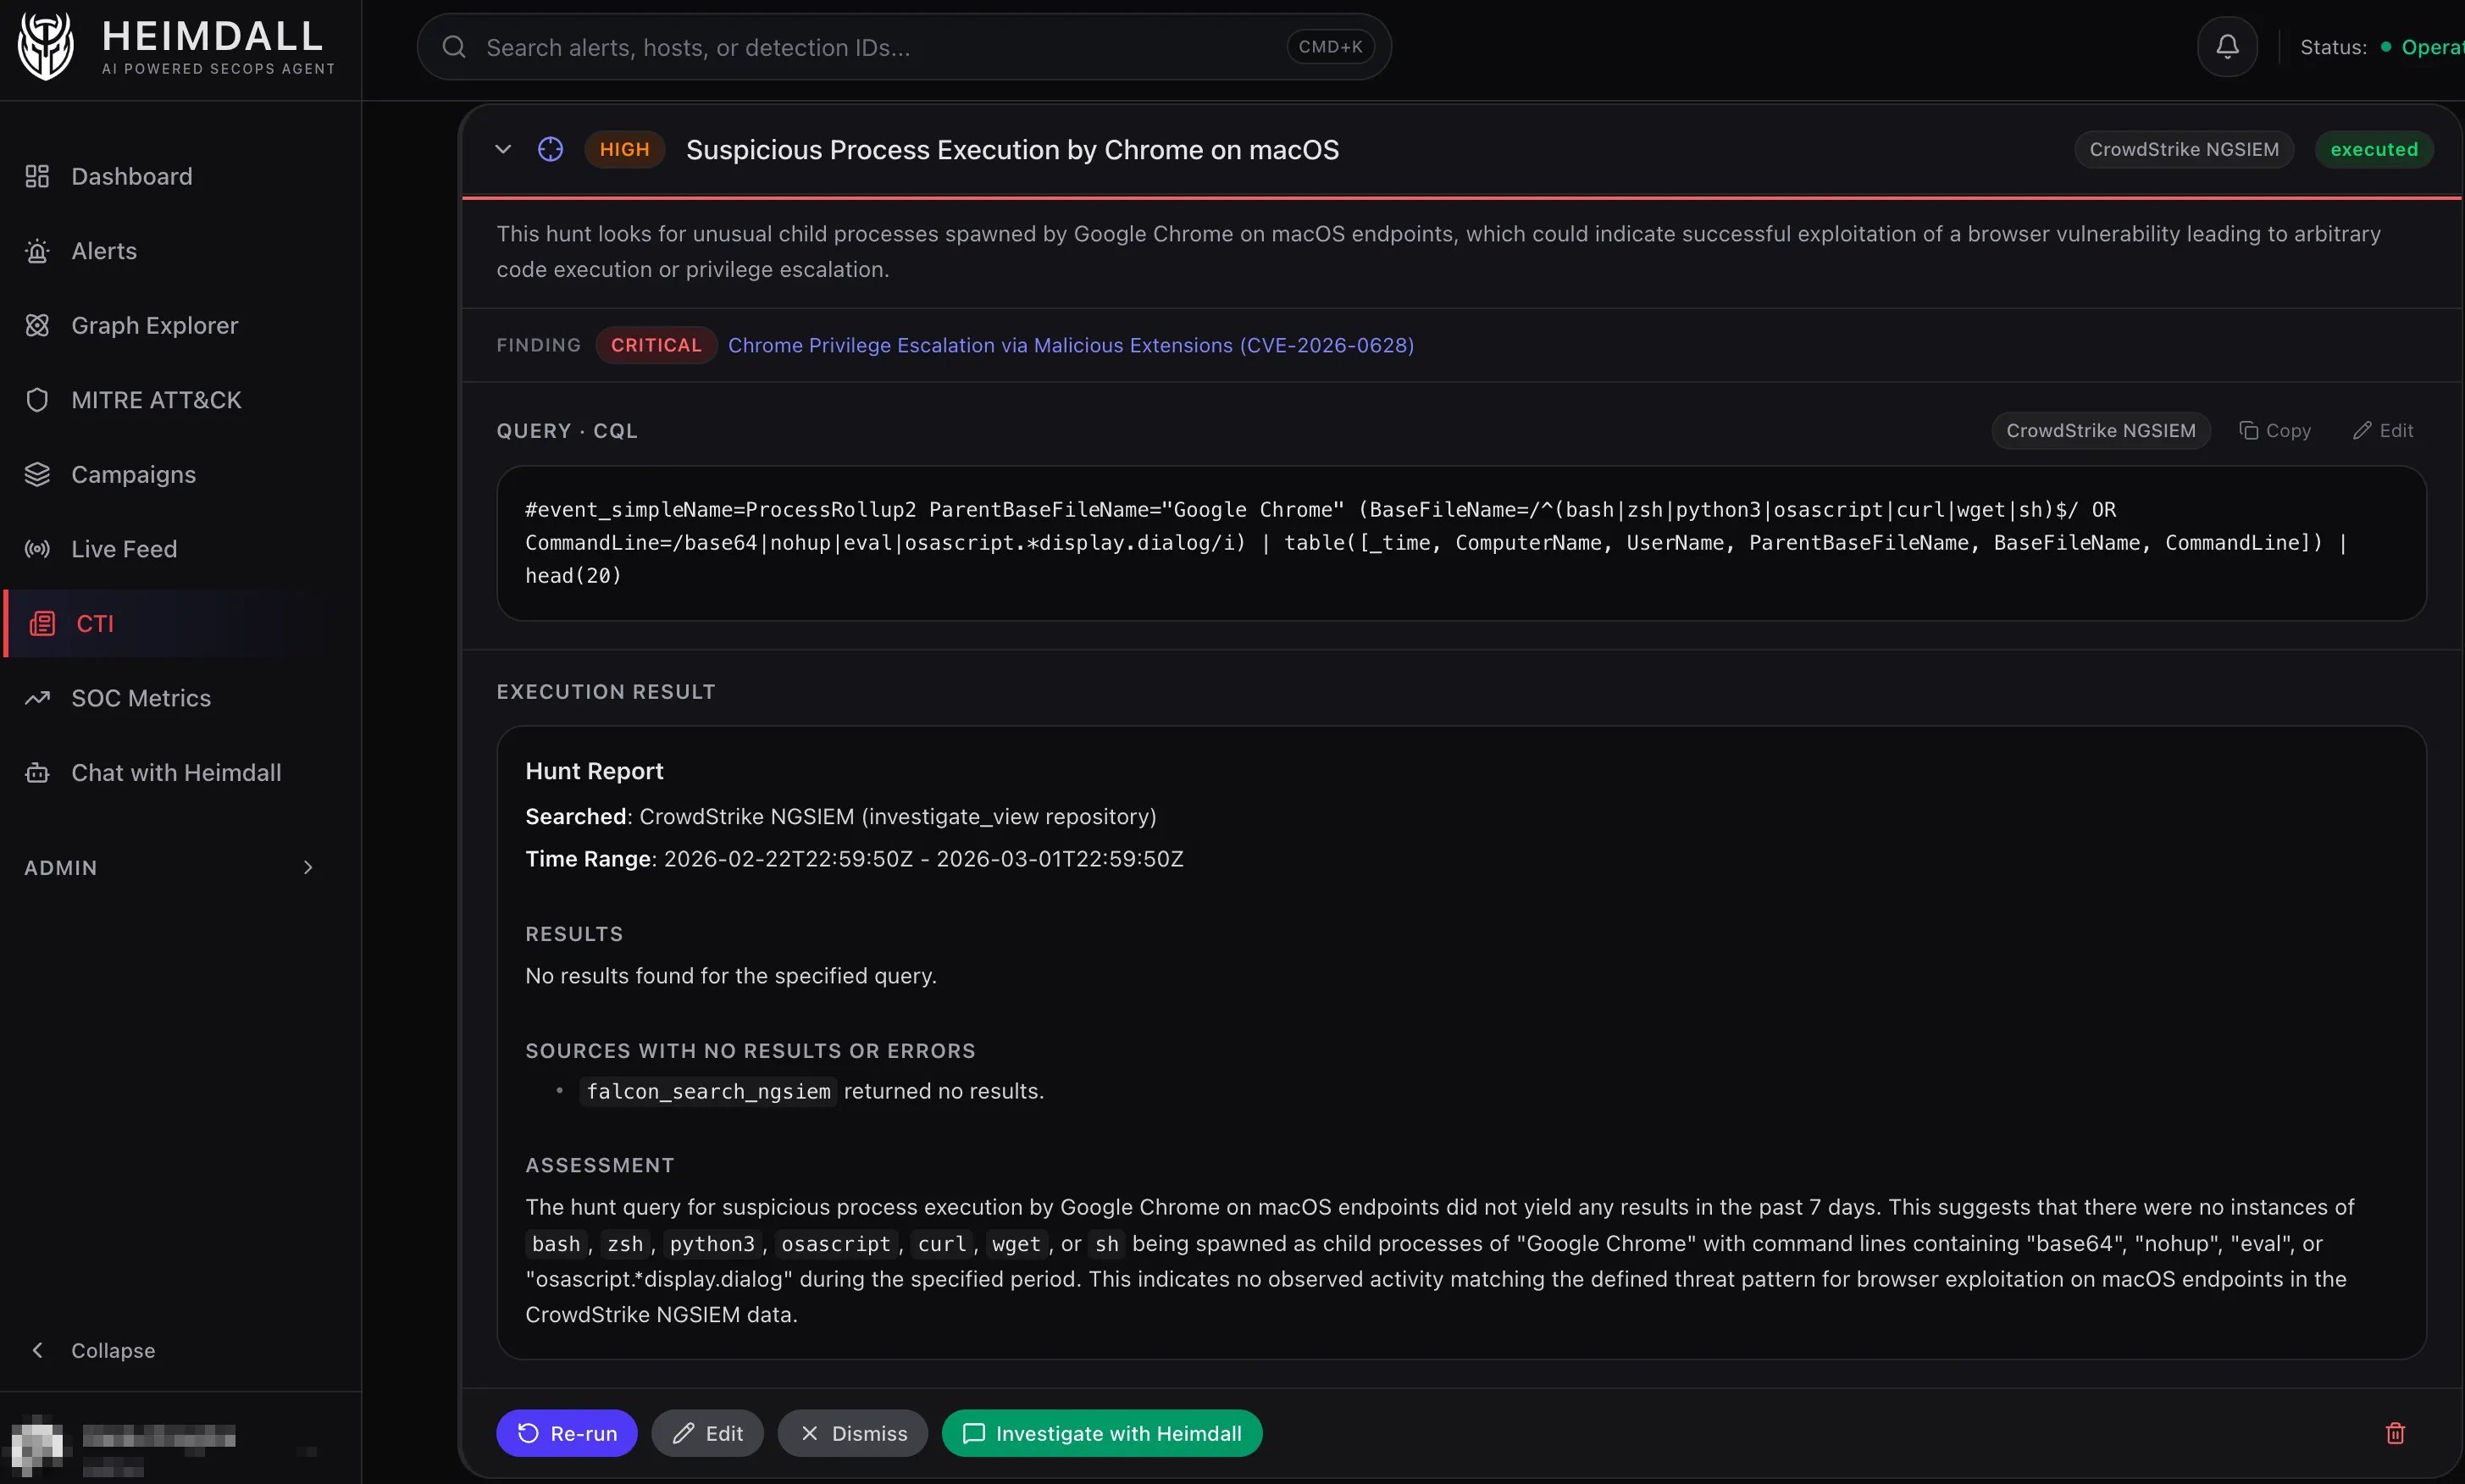
The screenshot above shows this workflow in action. After the CTI agent read about CVE-2026-0628 (a Chrome vulnerability allowing malicious extensions to escalate privileges via the Gemini panel), it generated a CQL hunt query targeting post-exploitation activity. The query looks for Google Chrome spawning suspicious child processes: shells like bash or zsh, interpreters like python3 or osascript, or download utilities like curl or wget, especially when those processes have command lines containing obfuscation patterns (base64, eval) or macOS-specific attack indicators (osascript display.dialog).
This is a good example of why the hunt generation step matters. CVE-2026-0628 itself happens entirely within Chrome’s privileged context, a malicious extension injecting JavaScript into the Gemini panel. You can’t detect that initial exploitation with endpoint telemetry. But you can detect what happens next: once an attacker has escalated privileges, they’ll often spawn processes to execute commands, download payloads, or interact with the system.
The CTI agent correctly identified that pattern and proposed a hunt for it.
In this case, the hunt returned no results, which is good news. It means there were no instances of Chrome spawning suspicious processes matching this pattern in the past 7 days.
One thing to note: the query is useful for detecting follow-on activity after exploitation, not the initial browser-based exploit.
What’s Working
The pipeline is functional. A sweep takes about 30–60 seconds: ~10 seconds to fetch all 16 feeds, ~2 seconds to score and filter, and the rest is the LLM generating the briefing and hunt proposals. Cost is roughly $0.02–0.05 per sweep depending on how many articles pass the relevance filter.
The tech-stack matching is surprisingly effective at filtering noise. In a typical 24-hour window with ~150 articles across all feeds, only 10–20 pass the relevance filter. That’s a manageable amount for the LLM to analyse without burning tokens on articles about Windows ransomware we’ll never see.
The hunt queries are mostly correct. The agent gets CQL syntax right about 80% of the time, ES|QL about 85%, and CloudWatch Logs Insights about 90%. The main failure mode is field names: the agent occasionally invents a field that doesn’t exist in the index. That’s why the edit capability exists: fix the field name, re-execute.
What’s Not Done Yet
This is the honest part.
Hunt feedback loop. When a hunt executes and finds something, that result should feed back into the scoring engine. If every hunt from CISA advisories finds real exposure but hunts from vendor blogs never do, the system should learn that. Right now it doesn’t.
Dashboard integration. The API endpoints are all there (/cti/sweeps, /cti/findings, /cti/hunts, /cti/costs), but the dashboard pages for browsing findings and managing hunts are minimal. You can see the data, but it’s not the polished experience the rest of the dashboard has.
Validation. The hunt queries should be validated before being marked as ready. A lightweight syntax check (does this ES|QL query parse? does this CQL query reference real event types?) would catch the 15–20% of queries that need manual fixes.
Why I Think This Direction Matters
The traditional CTI workflow is: analyst reads report → analyst decides relevance → analyst writes detection rule → engineer deploys rule → rule fires (maybe). That’s a multi-day, multi-person process.
What I’m experimenting with compresses it to: feed arrives → system scores relevance → system proposes hunt → analyst reviews and executes. The human is still in the loop, but they’re reviewing a proposed query rather than starting from scratch.
It’s not a replacement for a real CTI team. But for a small security operation without dedicated threat intelligence analysts, having a system that reads the feeds for you and says “hey, this Chrome privilege escalation vulnerability from the CISA advisory might affect our macOS endpoints, here’s a CQL query to check” is meaningfully better than nobody reading the feeds at all.